
Tutorial: Using the History Player Widget in the Kaa Cloud
In the world of IoT and industrial automation, the ability to visualize and analyze historical data is crucial for effective monitoring and decision-making. The Kaa history player widget provides an advanced solution for this need, enabling users to play back history data within a specific timeline. This widget is not just a tool for data visualization; it is a powerful asset for analyzing trends, diagnosing issues, and optimizing performance over time.
In this step-by-step tutorial, we will guide you through the setup and configuration of the history player widget, as well as combining it with other Kaa widgets. But first, we'll explain what the main use cases are for the history player widget in Kaa.
Configuring geofence alerts
- Industrial equipment monitoring. Monitor the performance of machinery over time to identify patterns that could indicate wear and tear or the need for maintenance.
- Fleet management. Track vehicles' history routes and speeds to optimize logistics, improve fuel efficiency, and ensure compliance with regulations.
- Environmental monitoring. Analyze historical environmental data, such as temperature and humidity levels, to assess the impact on equipment and processes.
- Energy management. Review past energy consumption data to identify trends, optimize usage, and reduce costs.
- Smart building management. Track history data from building systems like HVAC and lighting to improve energy efficiency and occupant comfort.
Prerequisites:
- Active account in the Kaa IoT Cloud.
- Solution with connected devices
💡 Note: For this example, we will use the Fleet management template solution that includes the Python simulator and publishes the data suitable for our setup.
#1. Adding and configuring the history player widget
Step 1: Add the history player widget.
1. Open your dashboard.
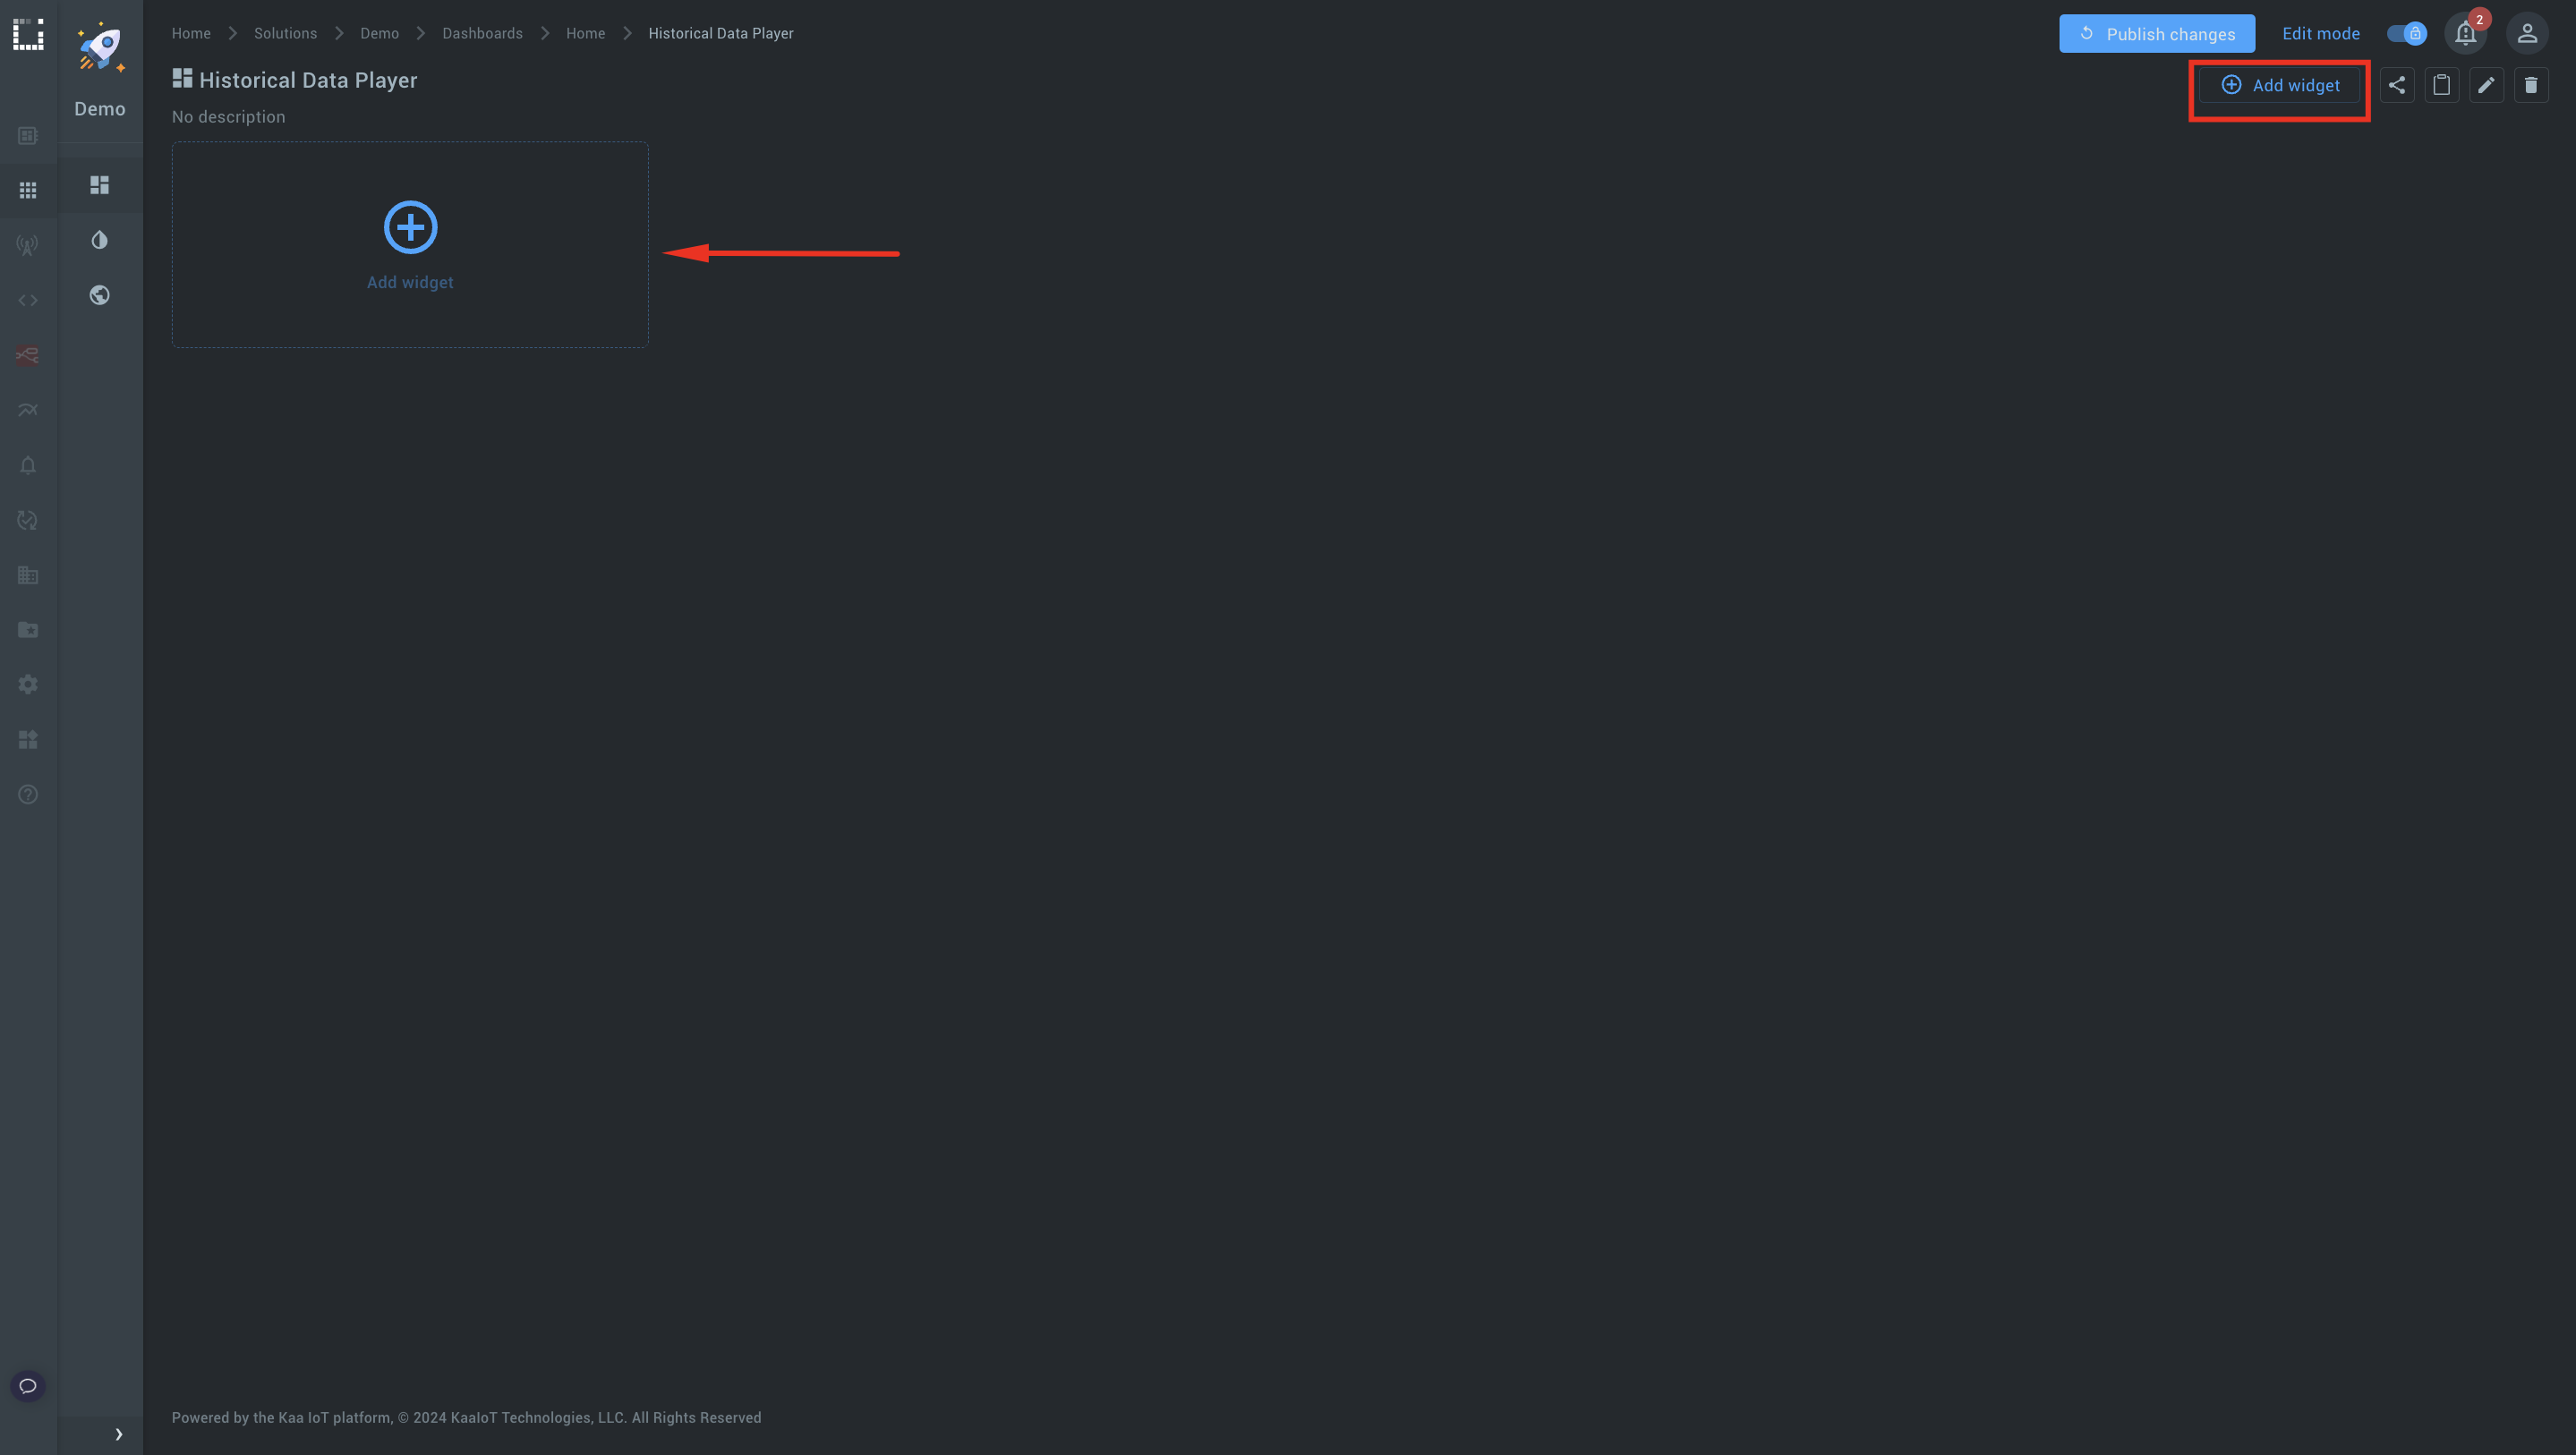
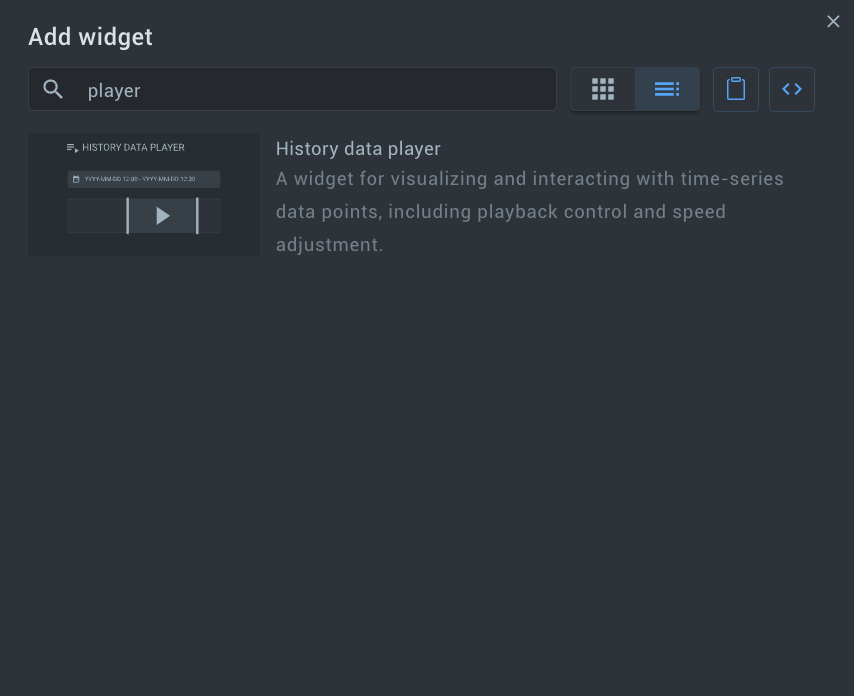
2. Click Add widget and search for the History data player widget using the keyword player.
3. Add the widget to your dashboard.
Step 2: Configure the widget.
1. Hit Edit” and start configuring the widget.
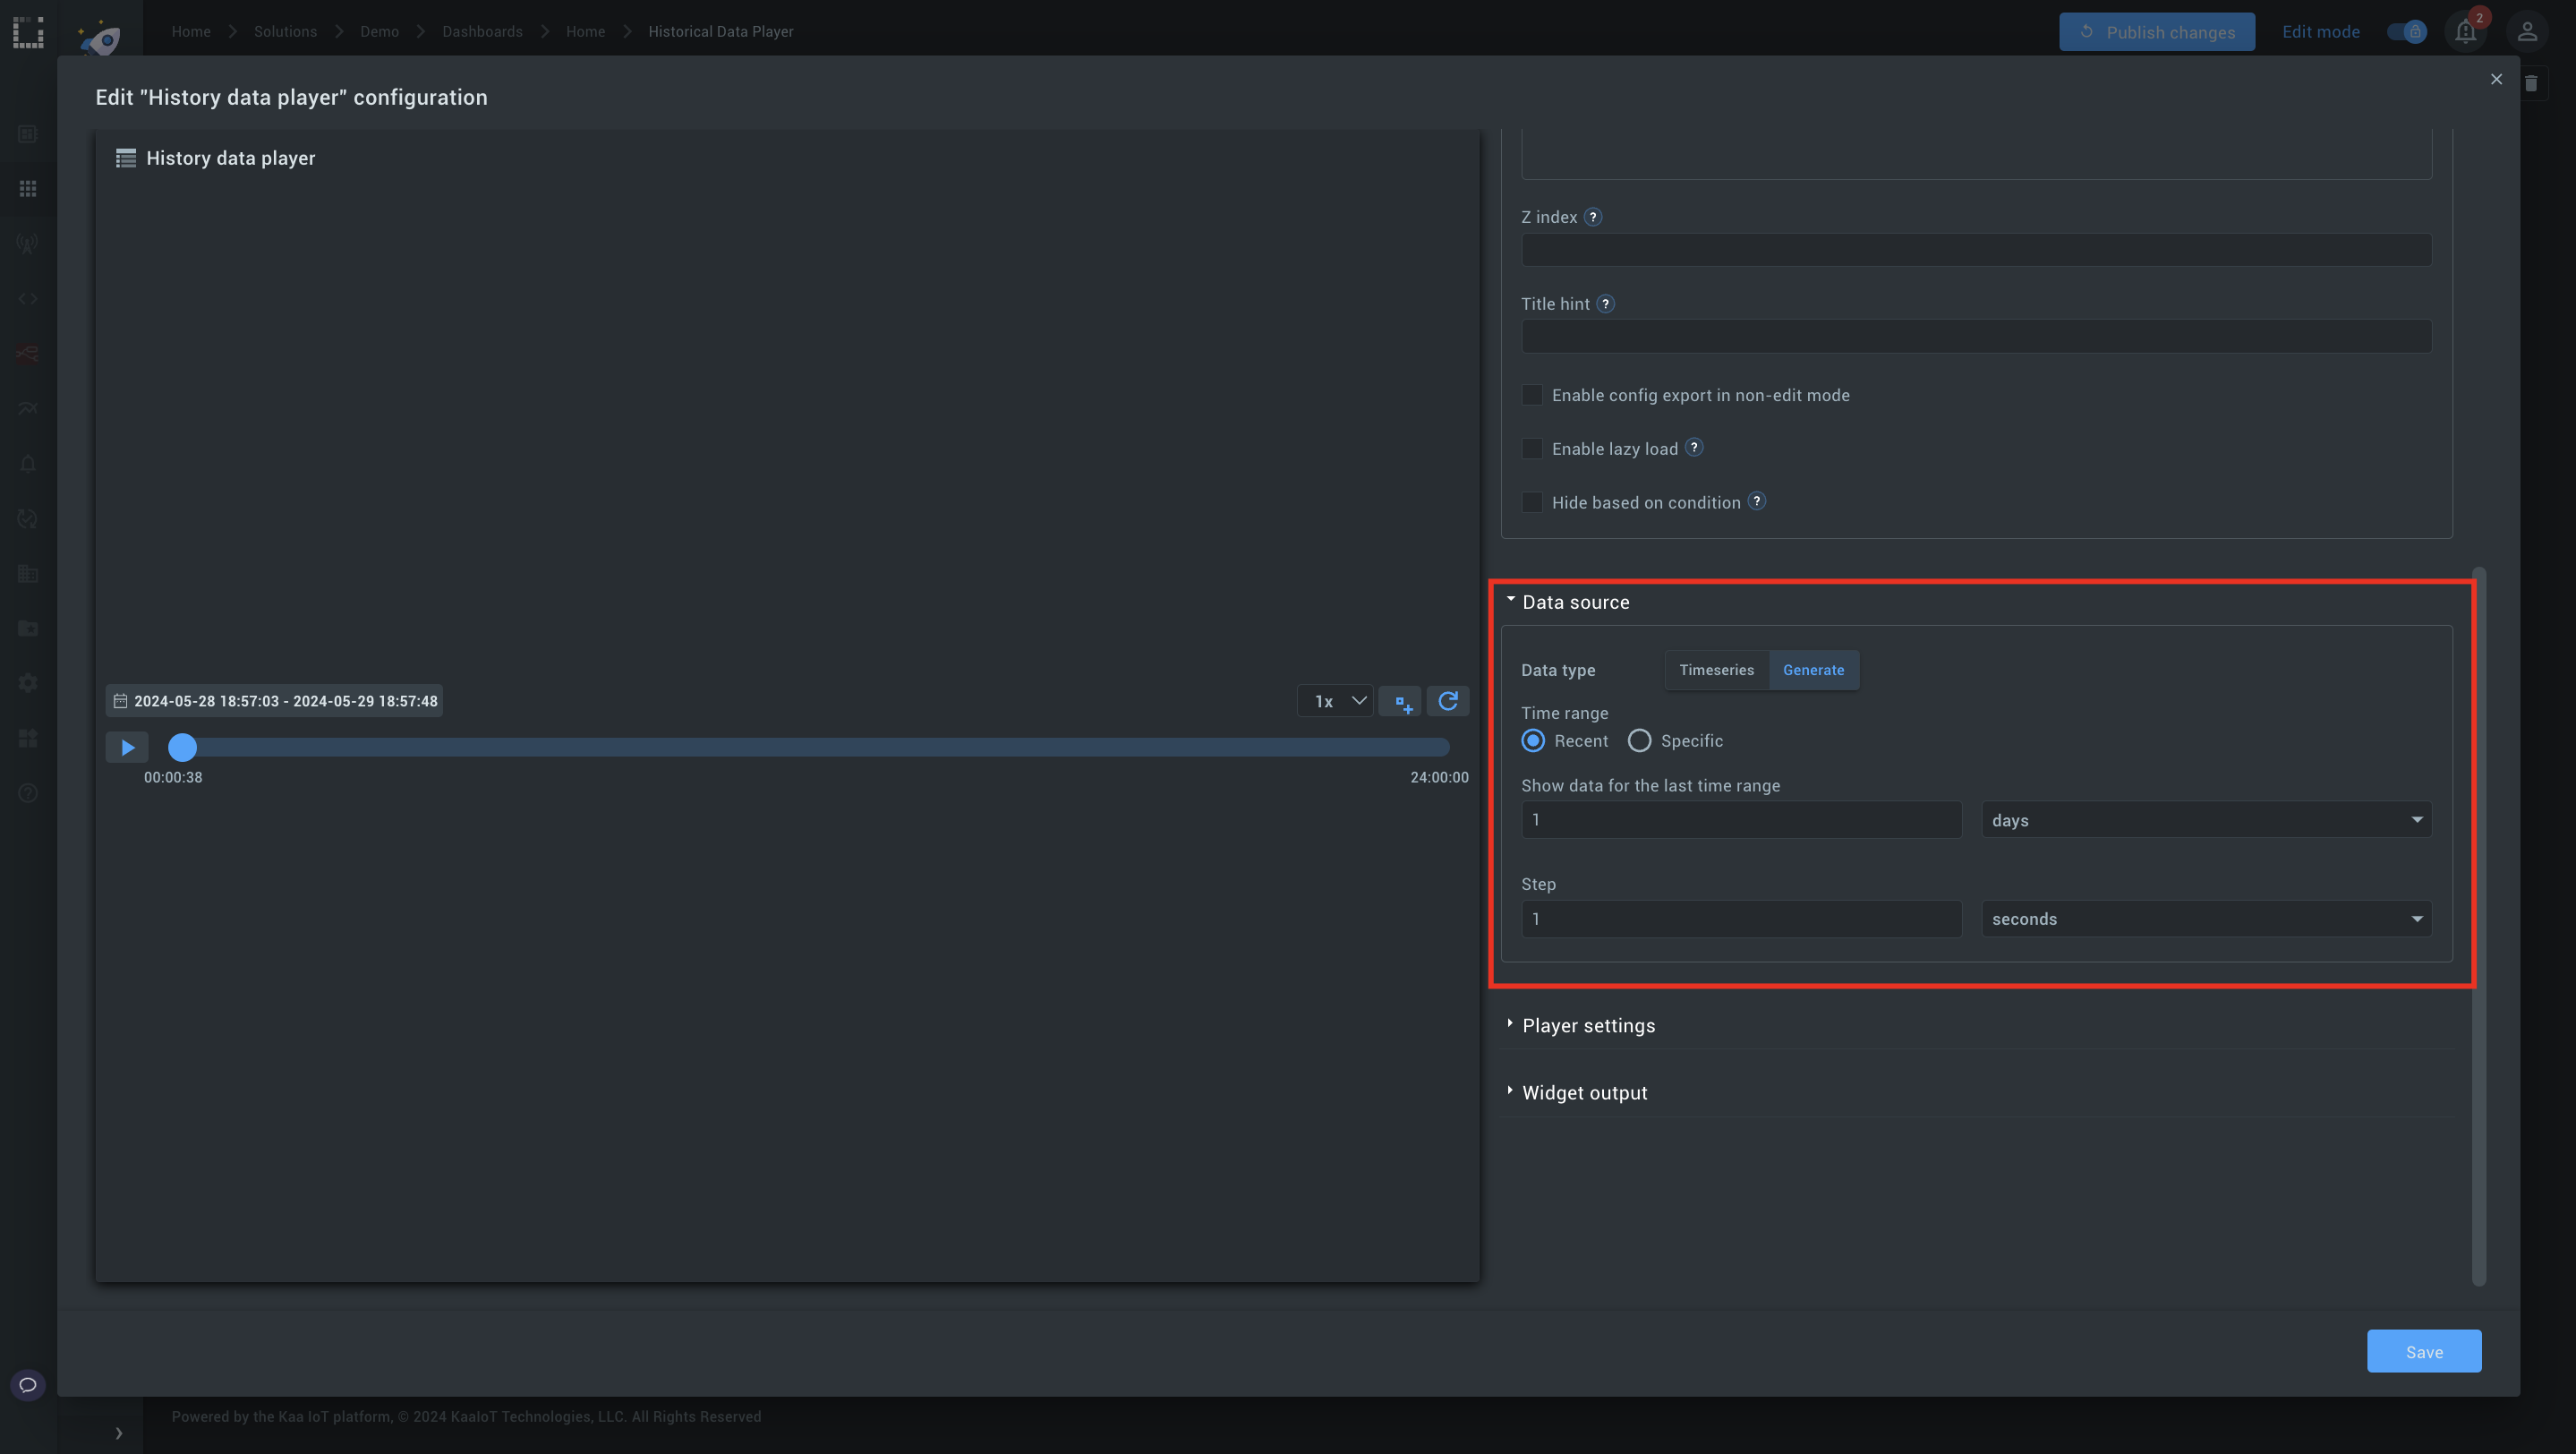
2. Data source: Choose between using existing time series data from your endpoint (“Timeseries”) or generating the timeline manually (“Generate”).
3. Set Time range and step: Define the time range (e.g., 1 day) and split it into steps (e.g., 1 second).
4. Play the timeline: Click Play to see if the Player works correctly and Save.
Step 3: Adjust the playback speed.
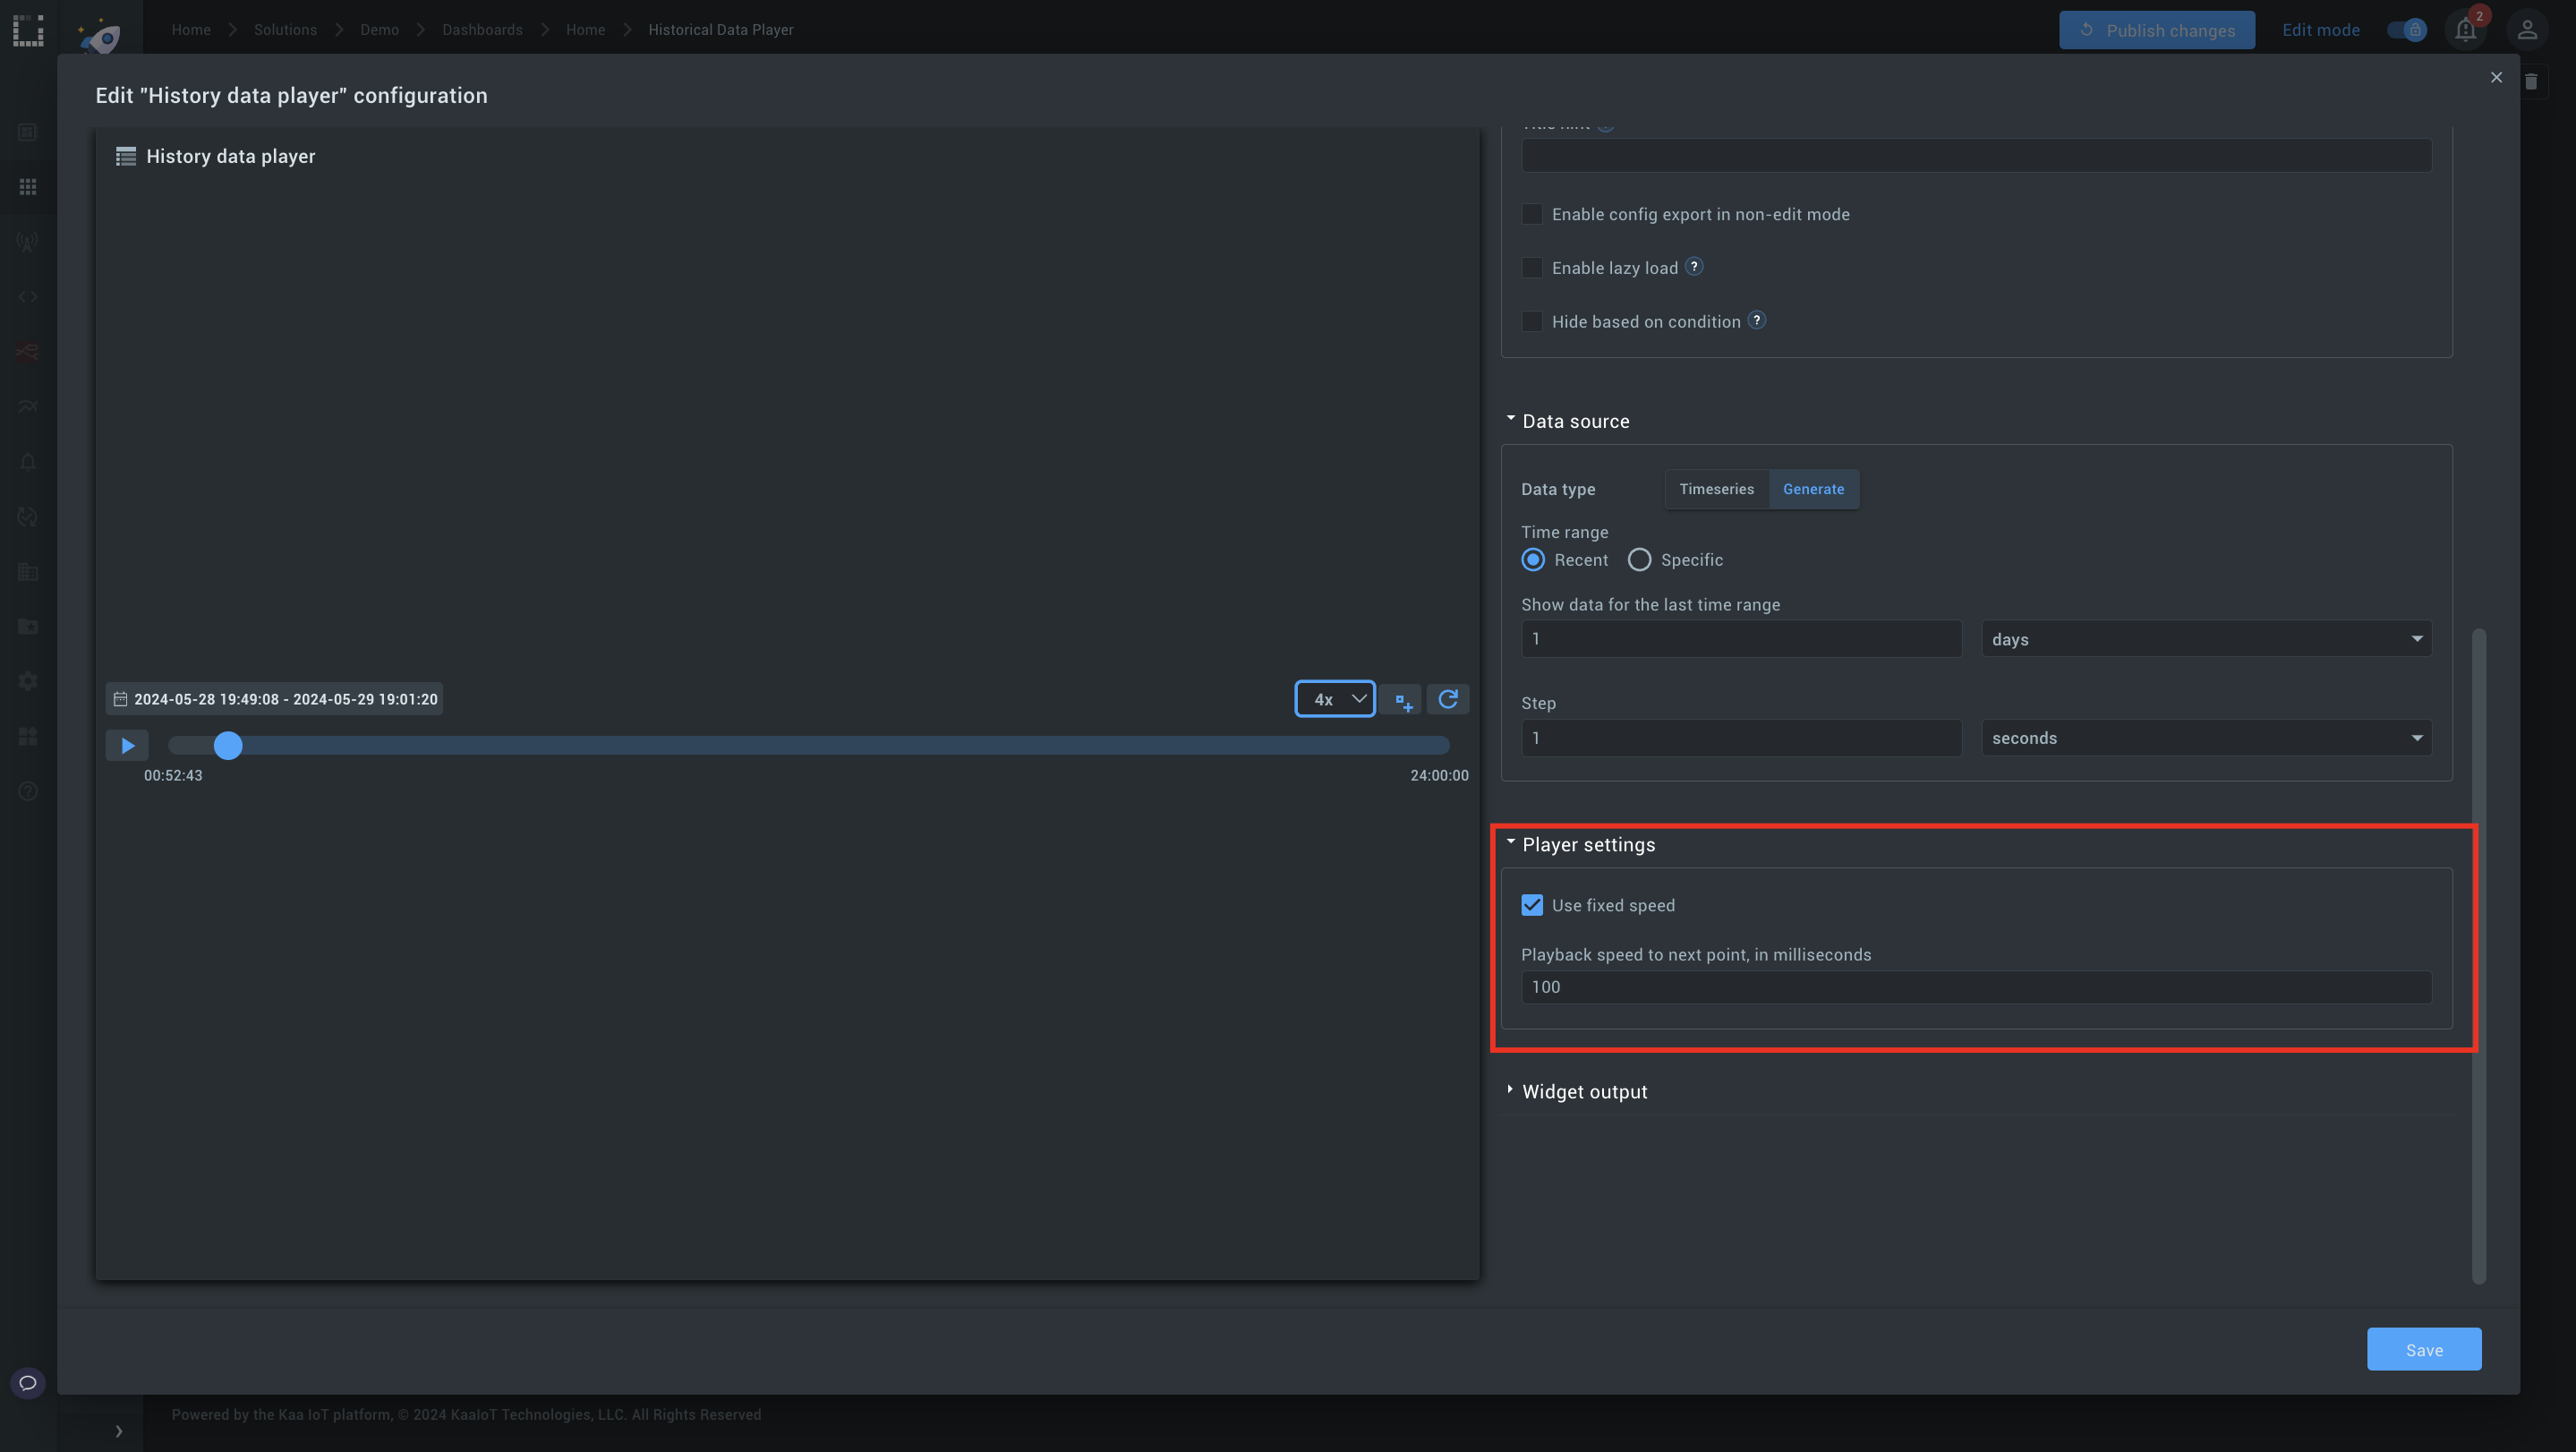
1. The default is set to 1000 seconds. To speed up playback, change this to another value, like 100 milliseconds.
2. Click Play to see faster data switching.
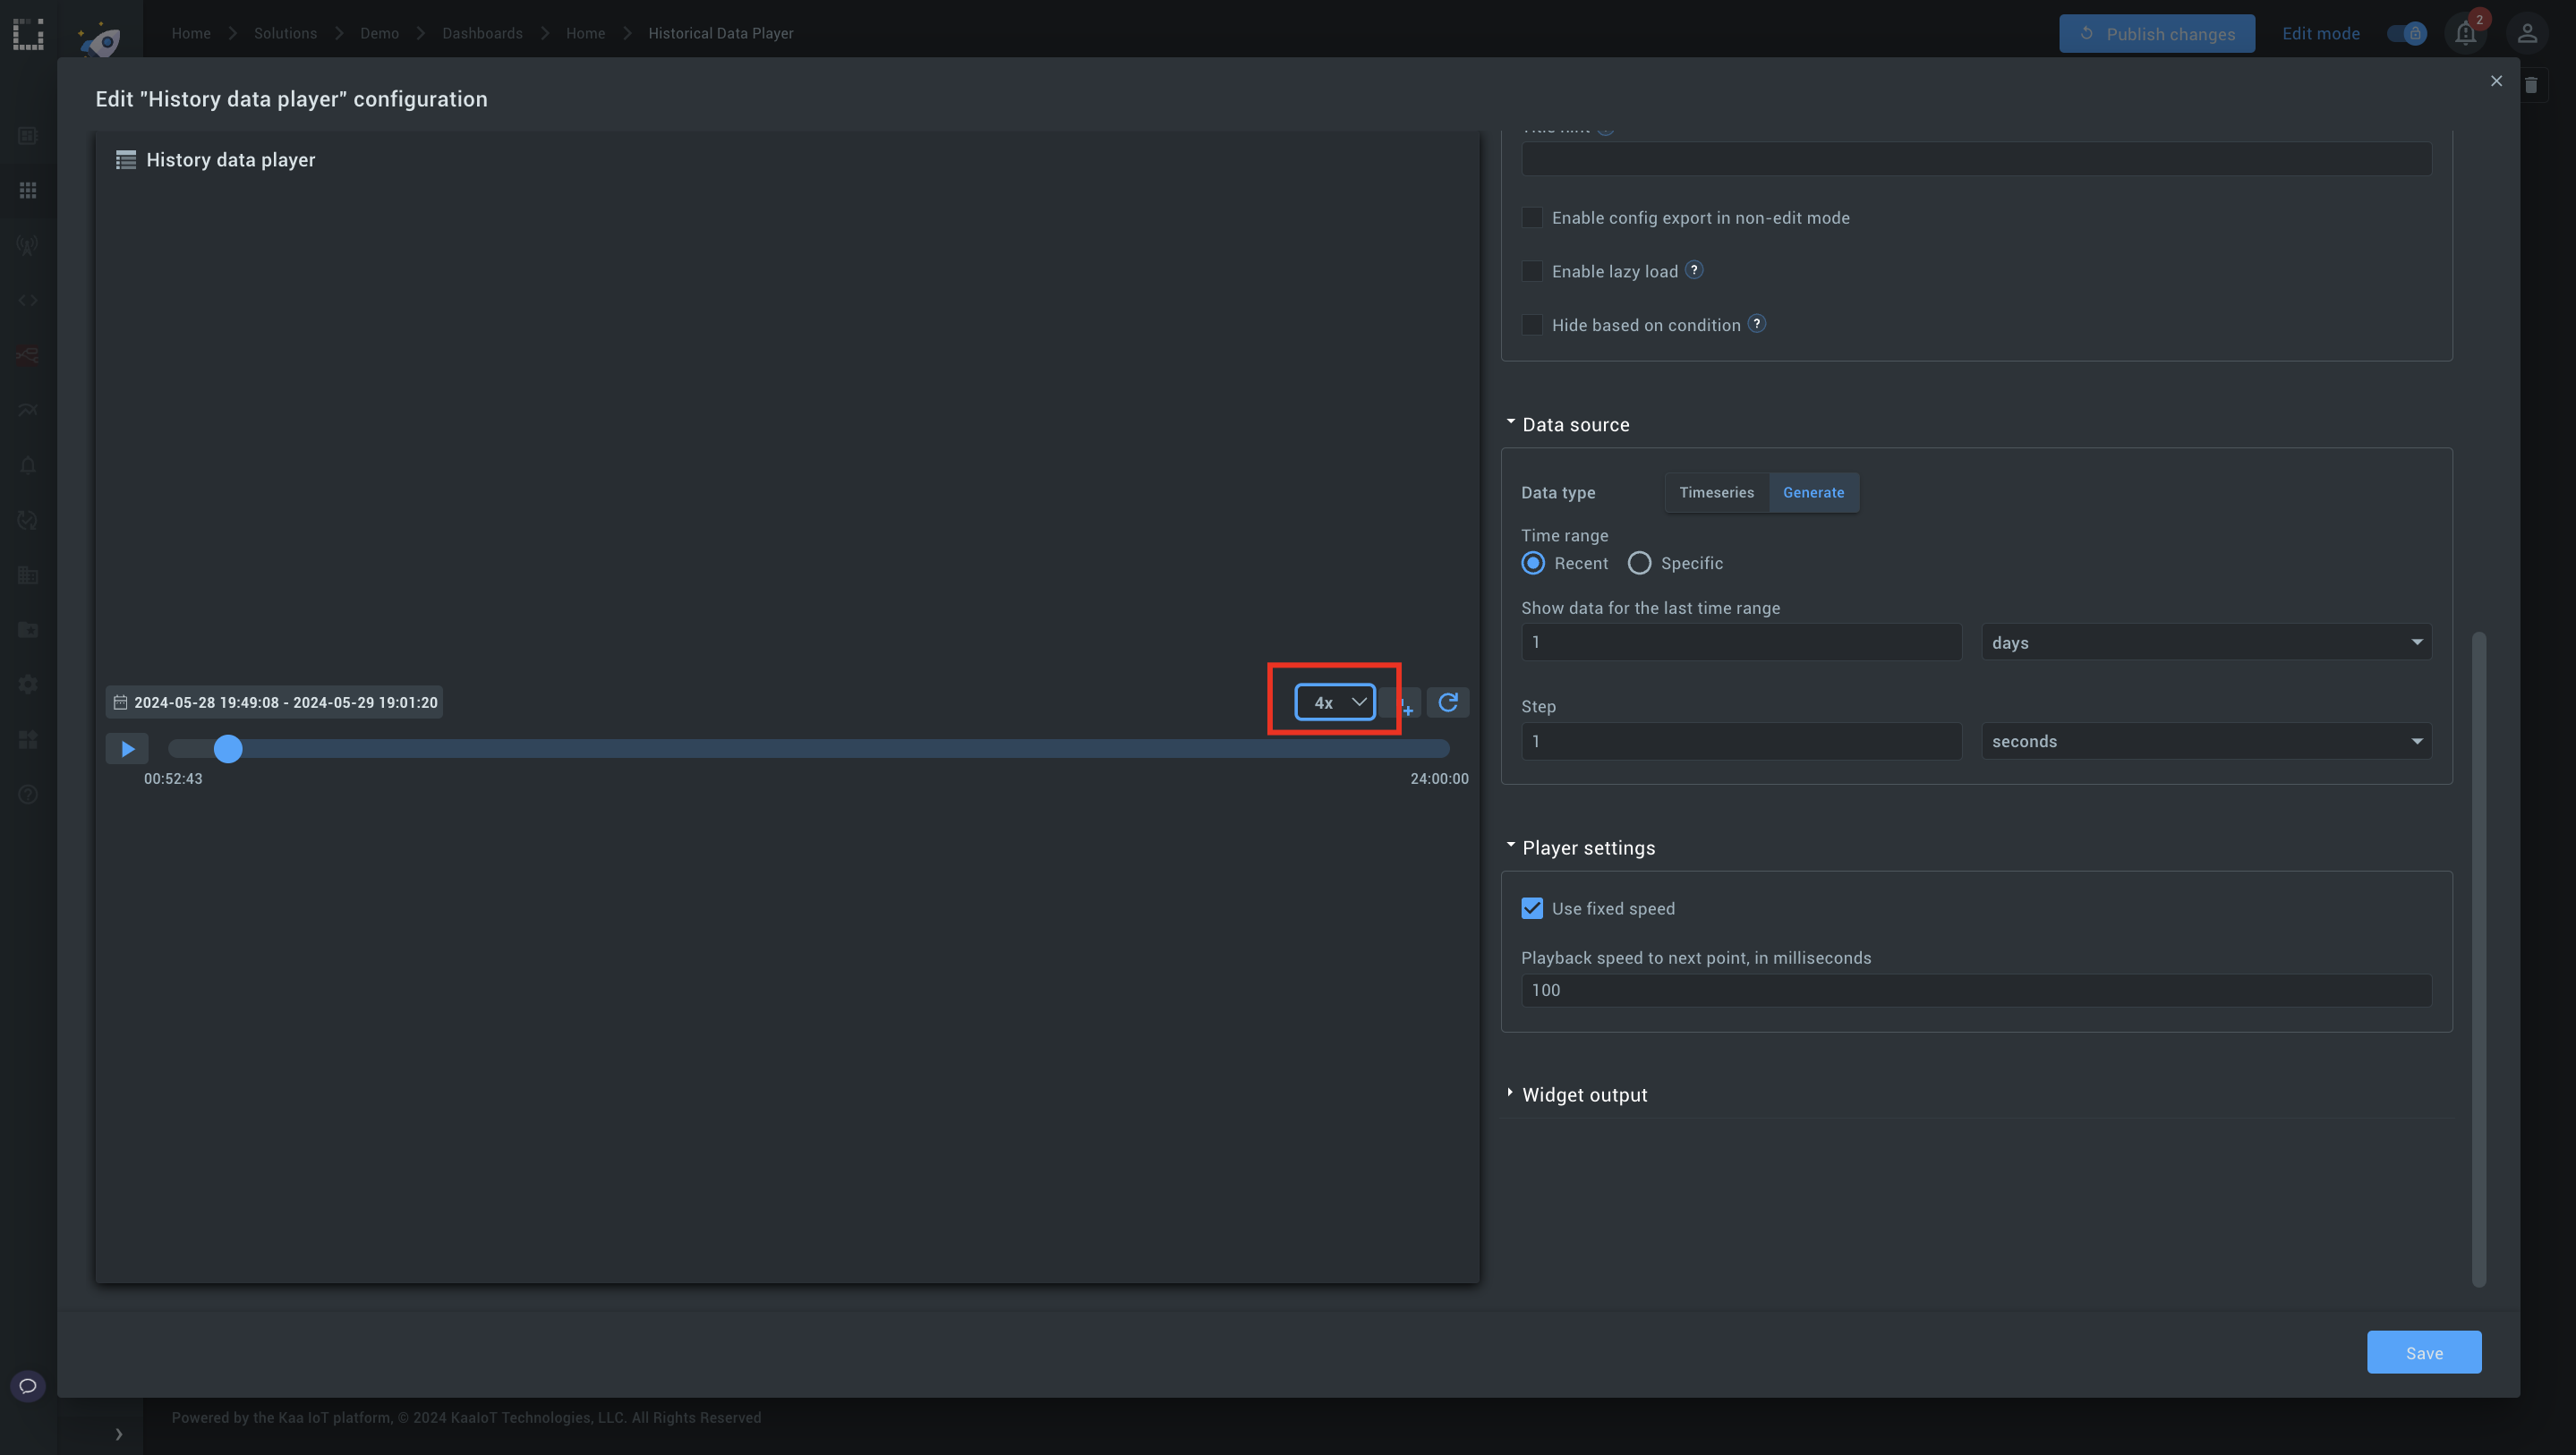
3. Use the speed selector to increase playback speed up to 2x, 4x, or 6x.
#2. Combining the history player with a time series chart
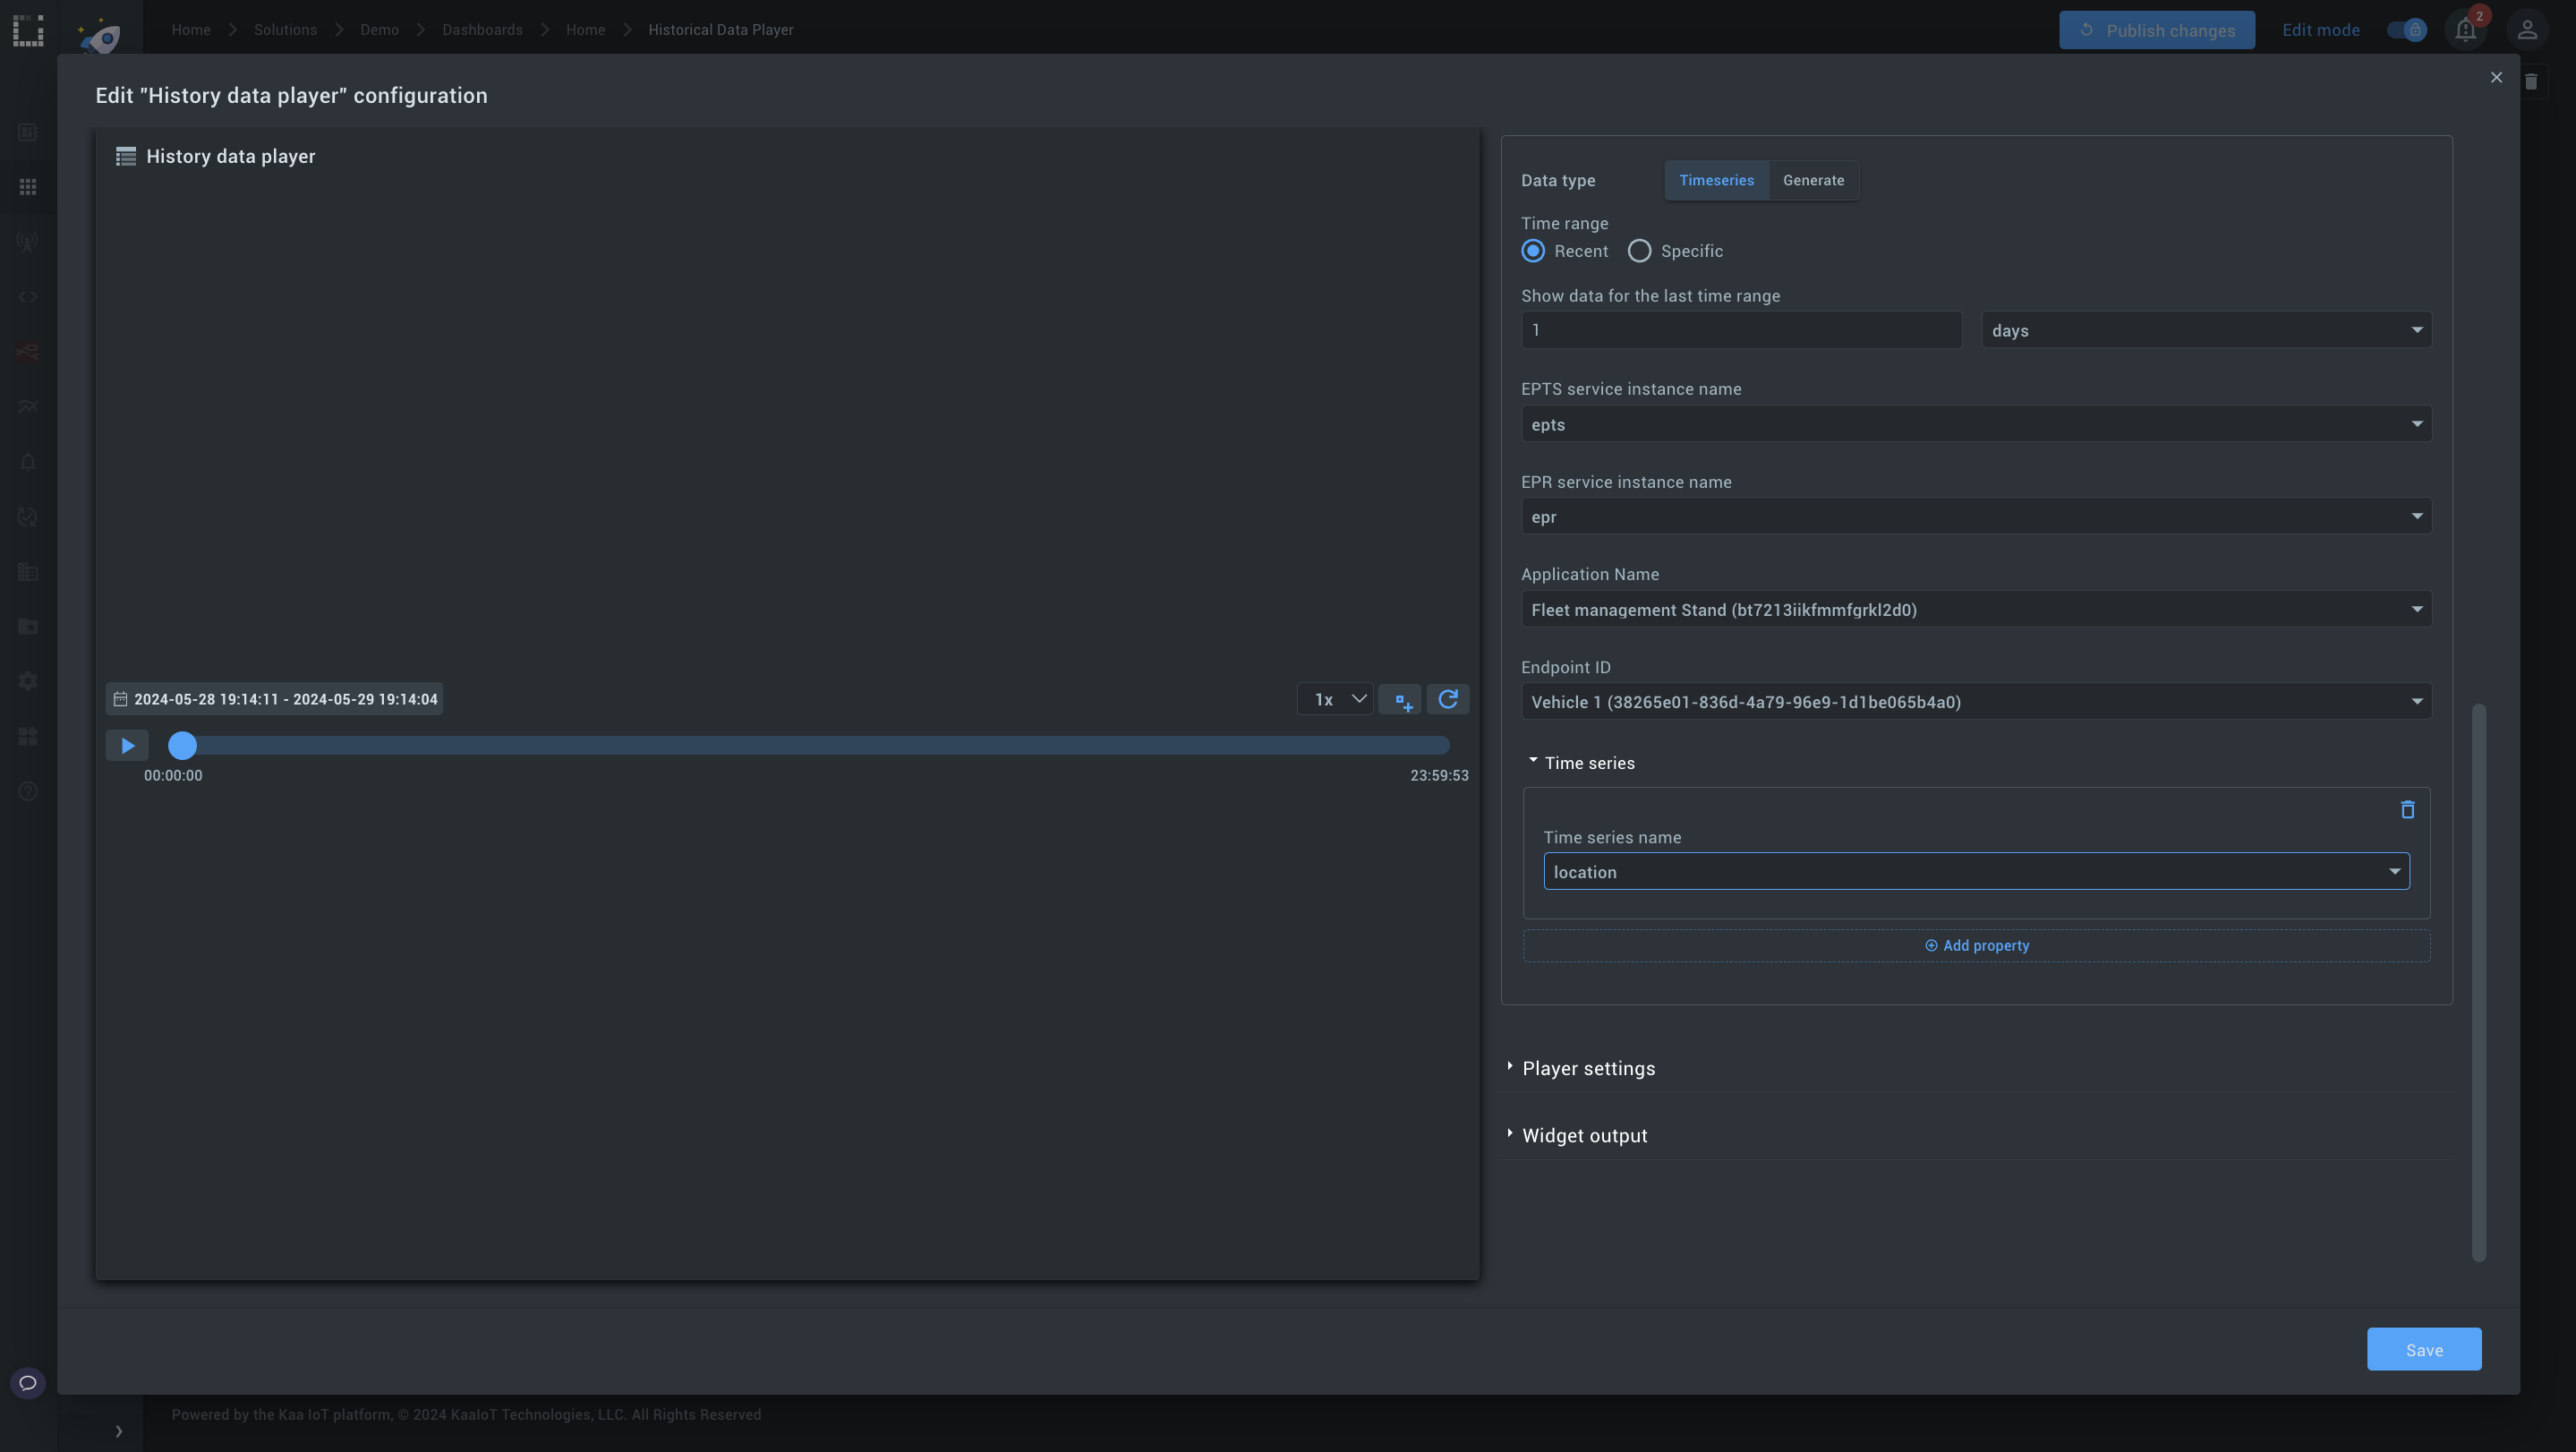
Step 1: Add the history player widget.
1. Hit Edit and start configuring the Player widget
2. Data source: Choose Timeseries (using existing time series data from your endpoint), your Application, and EndpointID.
3. Set Time range and Step: Define the time range (e.g., 1 day) and split it into steps (e.g., 1 second).
4. Select a Time series name to build your timeline (in our case it's location)
5. Widget output: Change variables in Event type for:
- Start date update (e.g., dashboard startDate)
- End date update (e.g., dashboard endDate)
- Current point update (e.g., dashboard currentPoint)
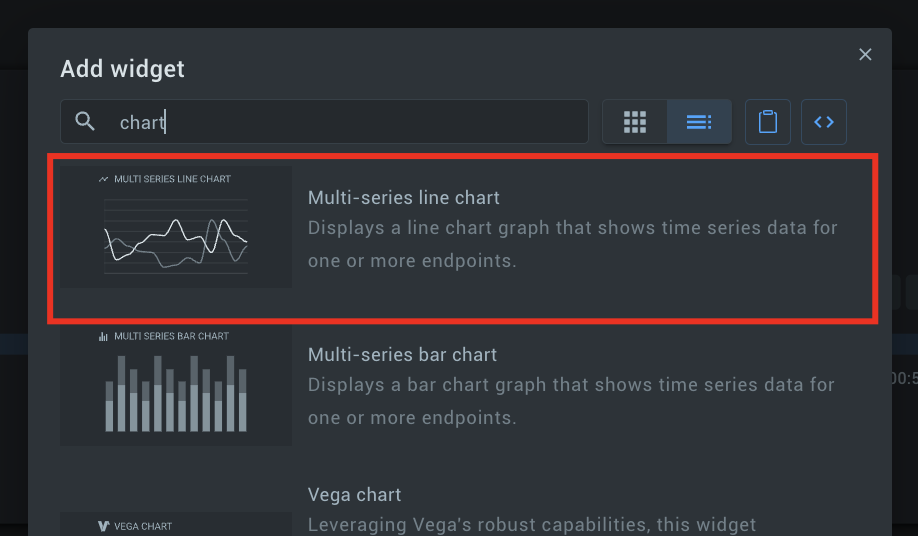
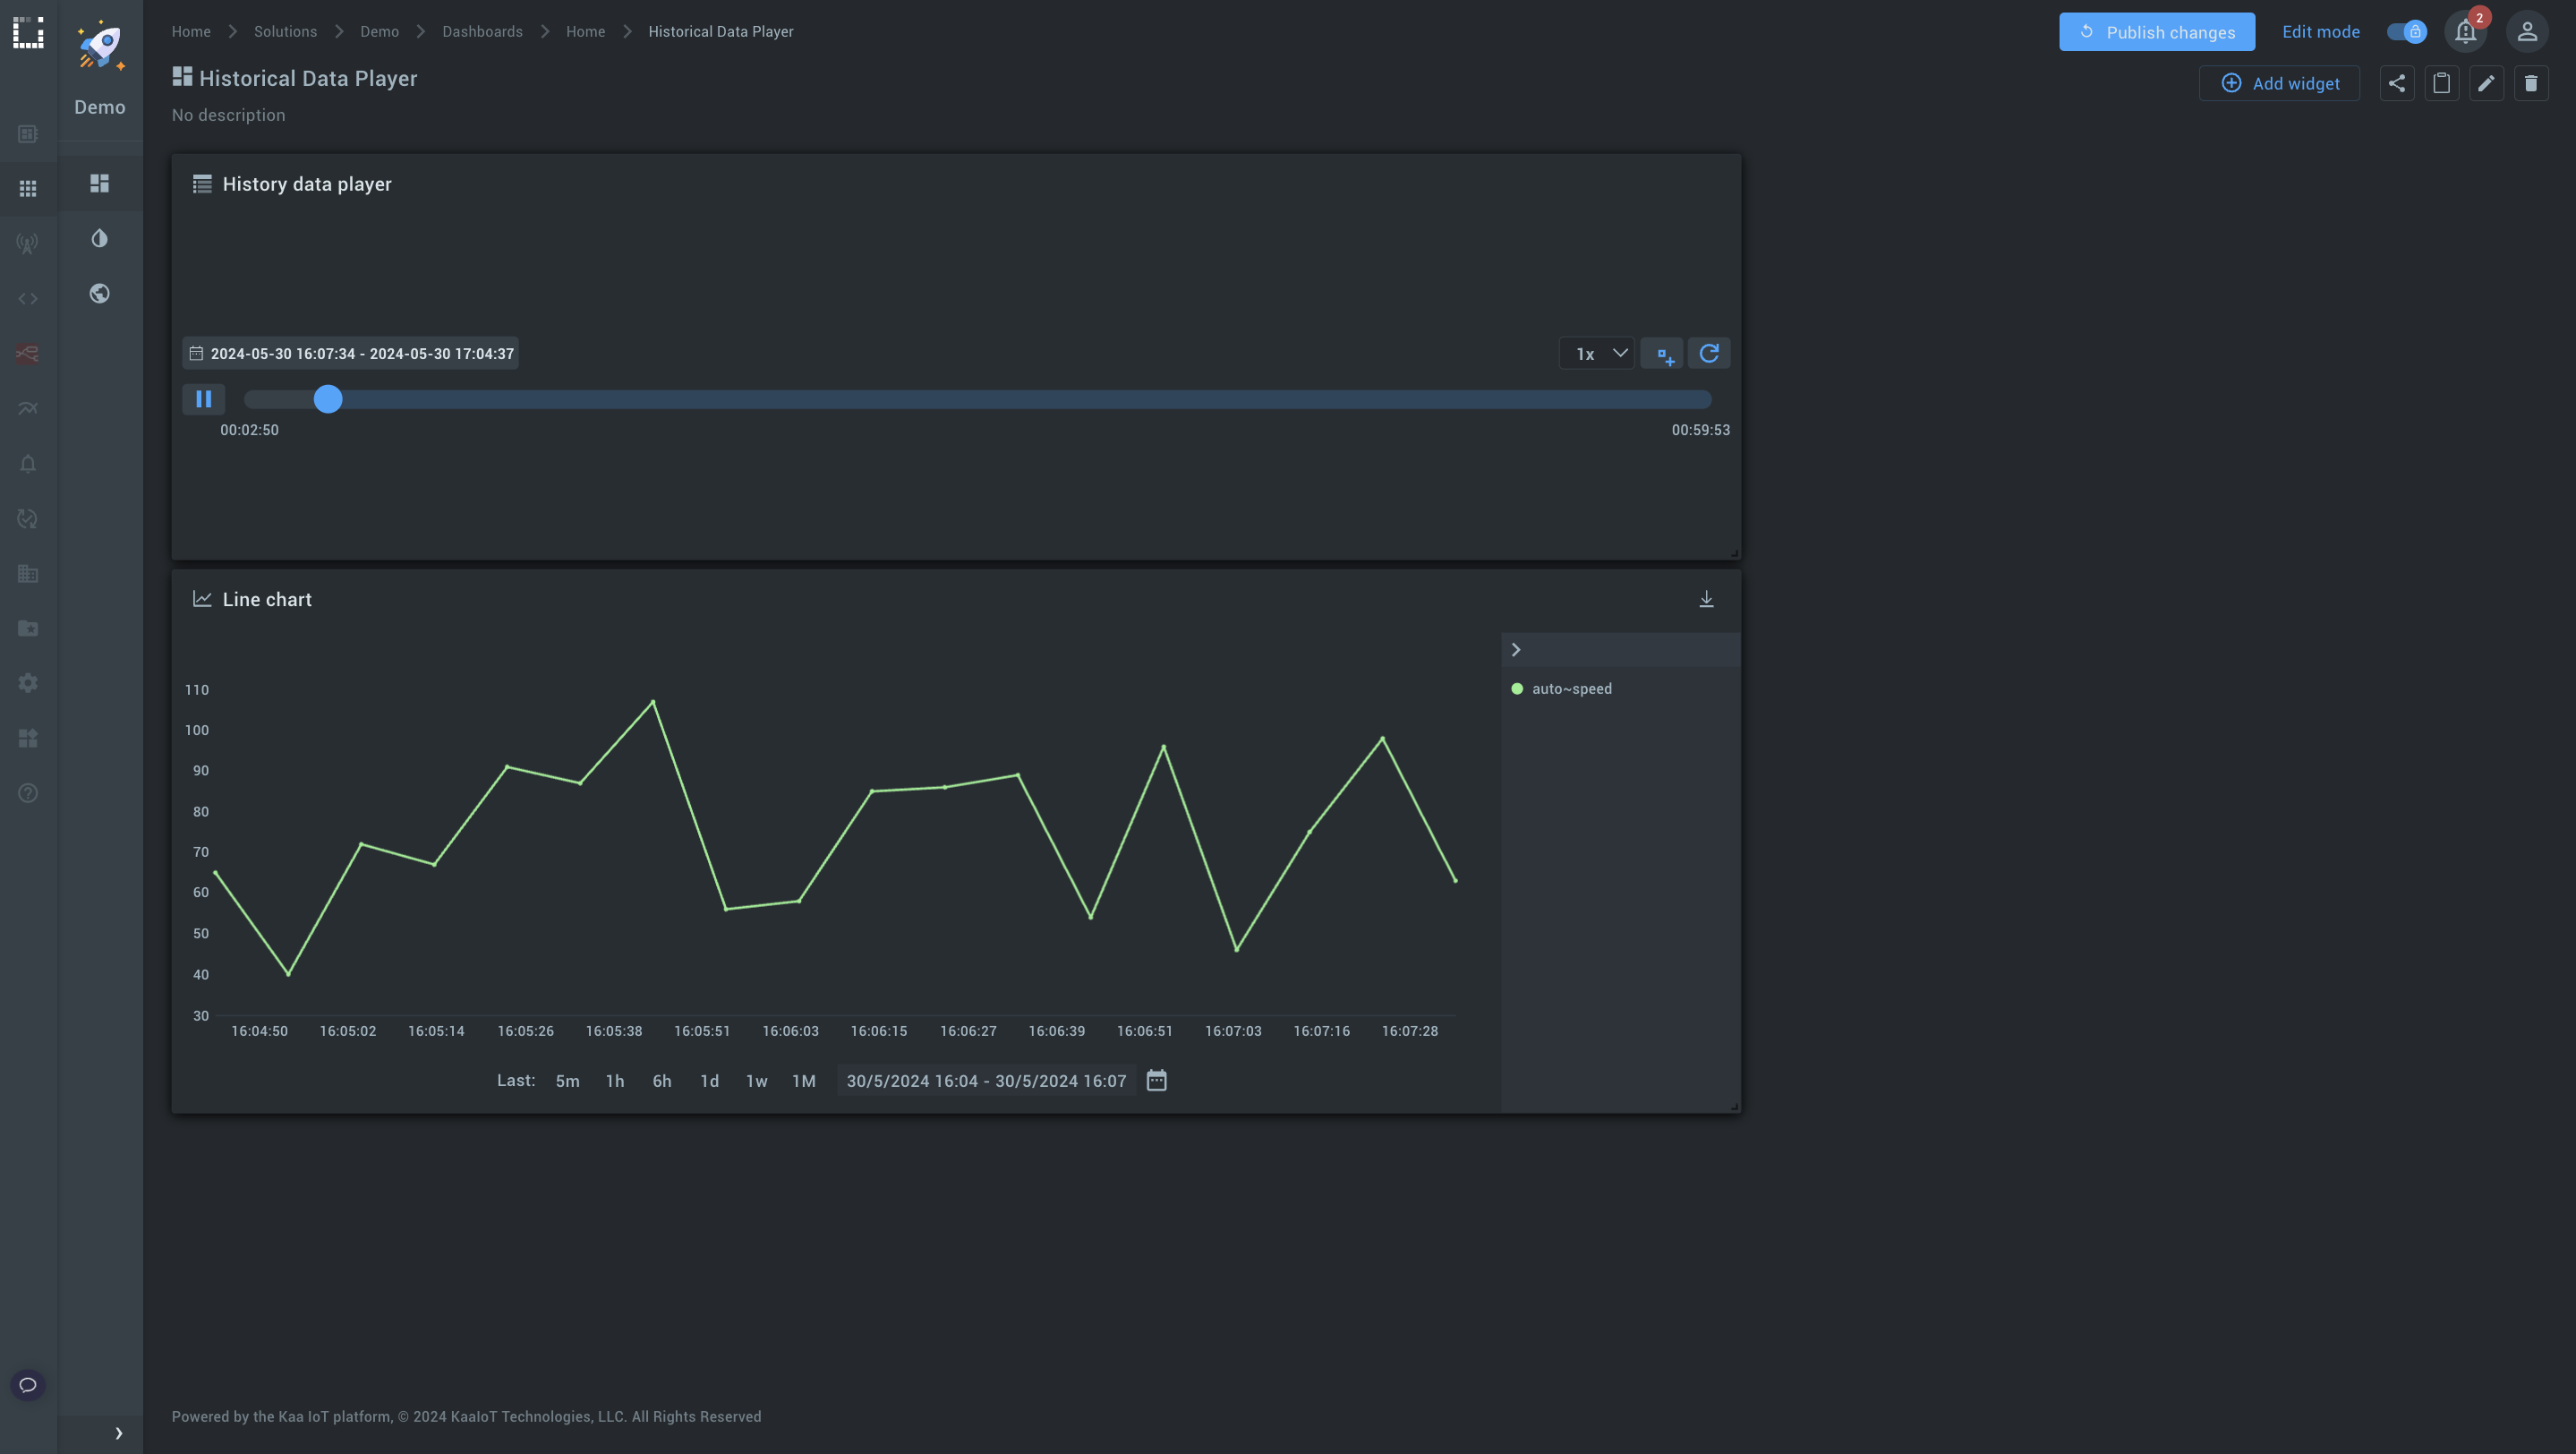
Step 2: Add a time series chart.
1. Add a Multi-series line chart widget to your dashboard.
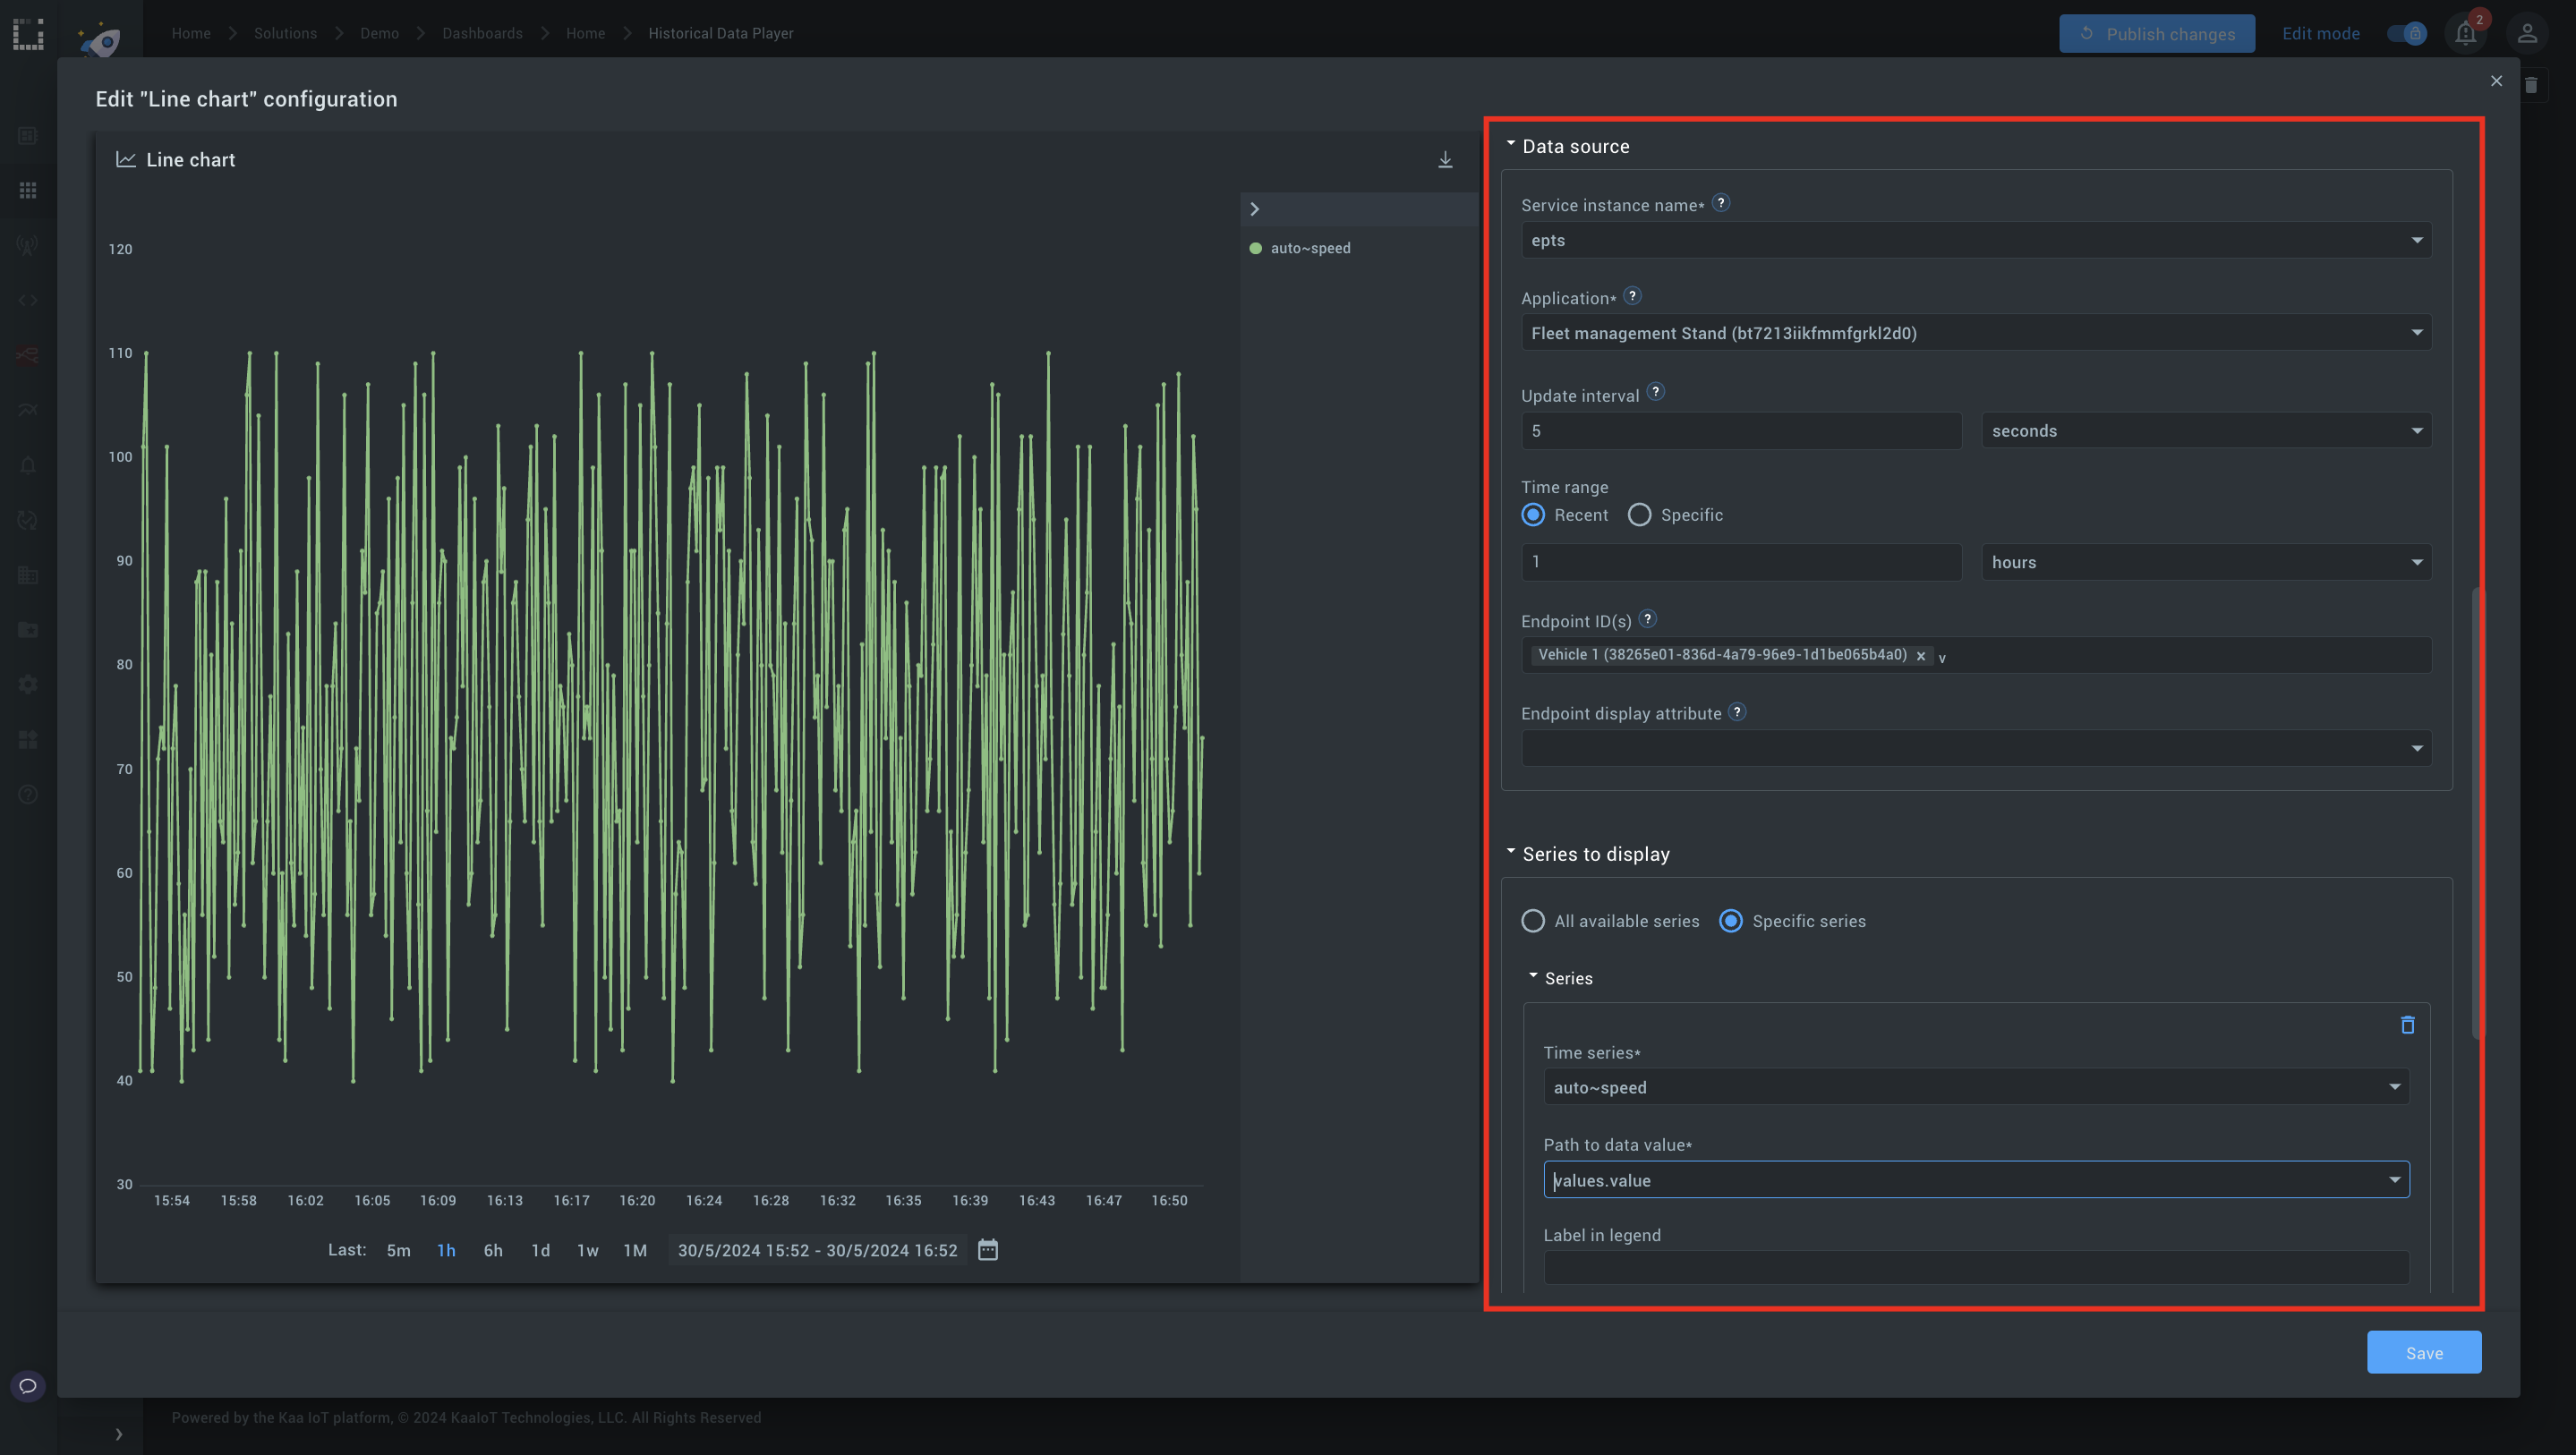
2. Configure the chart (Choosing the same as in Step 1)
- Select the relevant application.
- Choose your endpoint ID.
- Select the series to display you want to visualize (e.g. Speed).
Step 3: Link to the history player.
Set the time range in the data source to Specific and choose variables you created in Step 1.
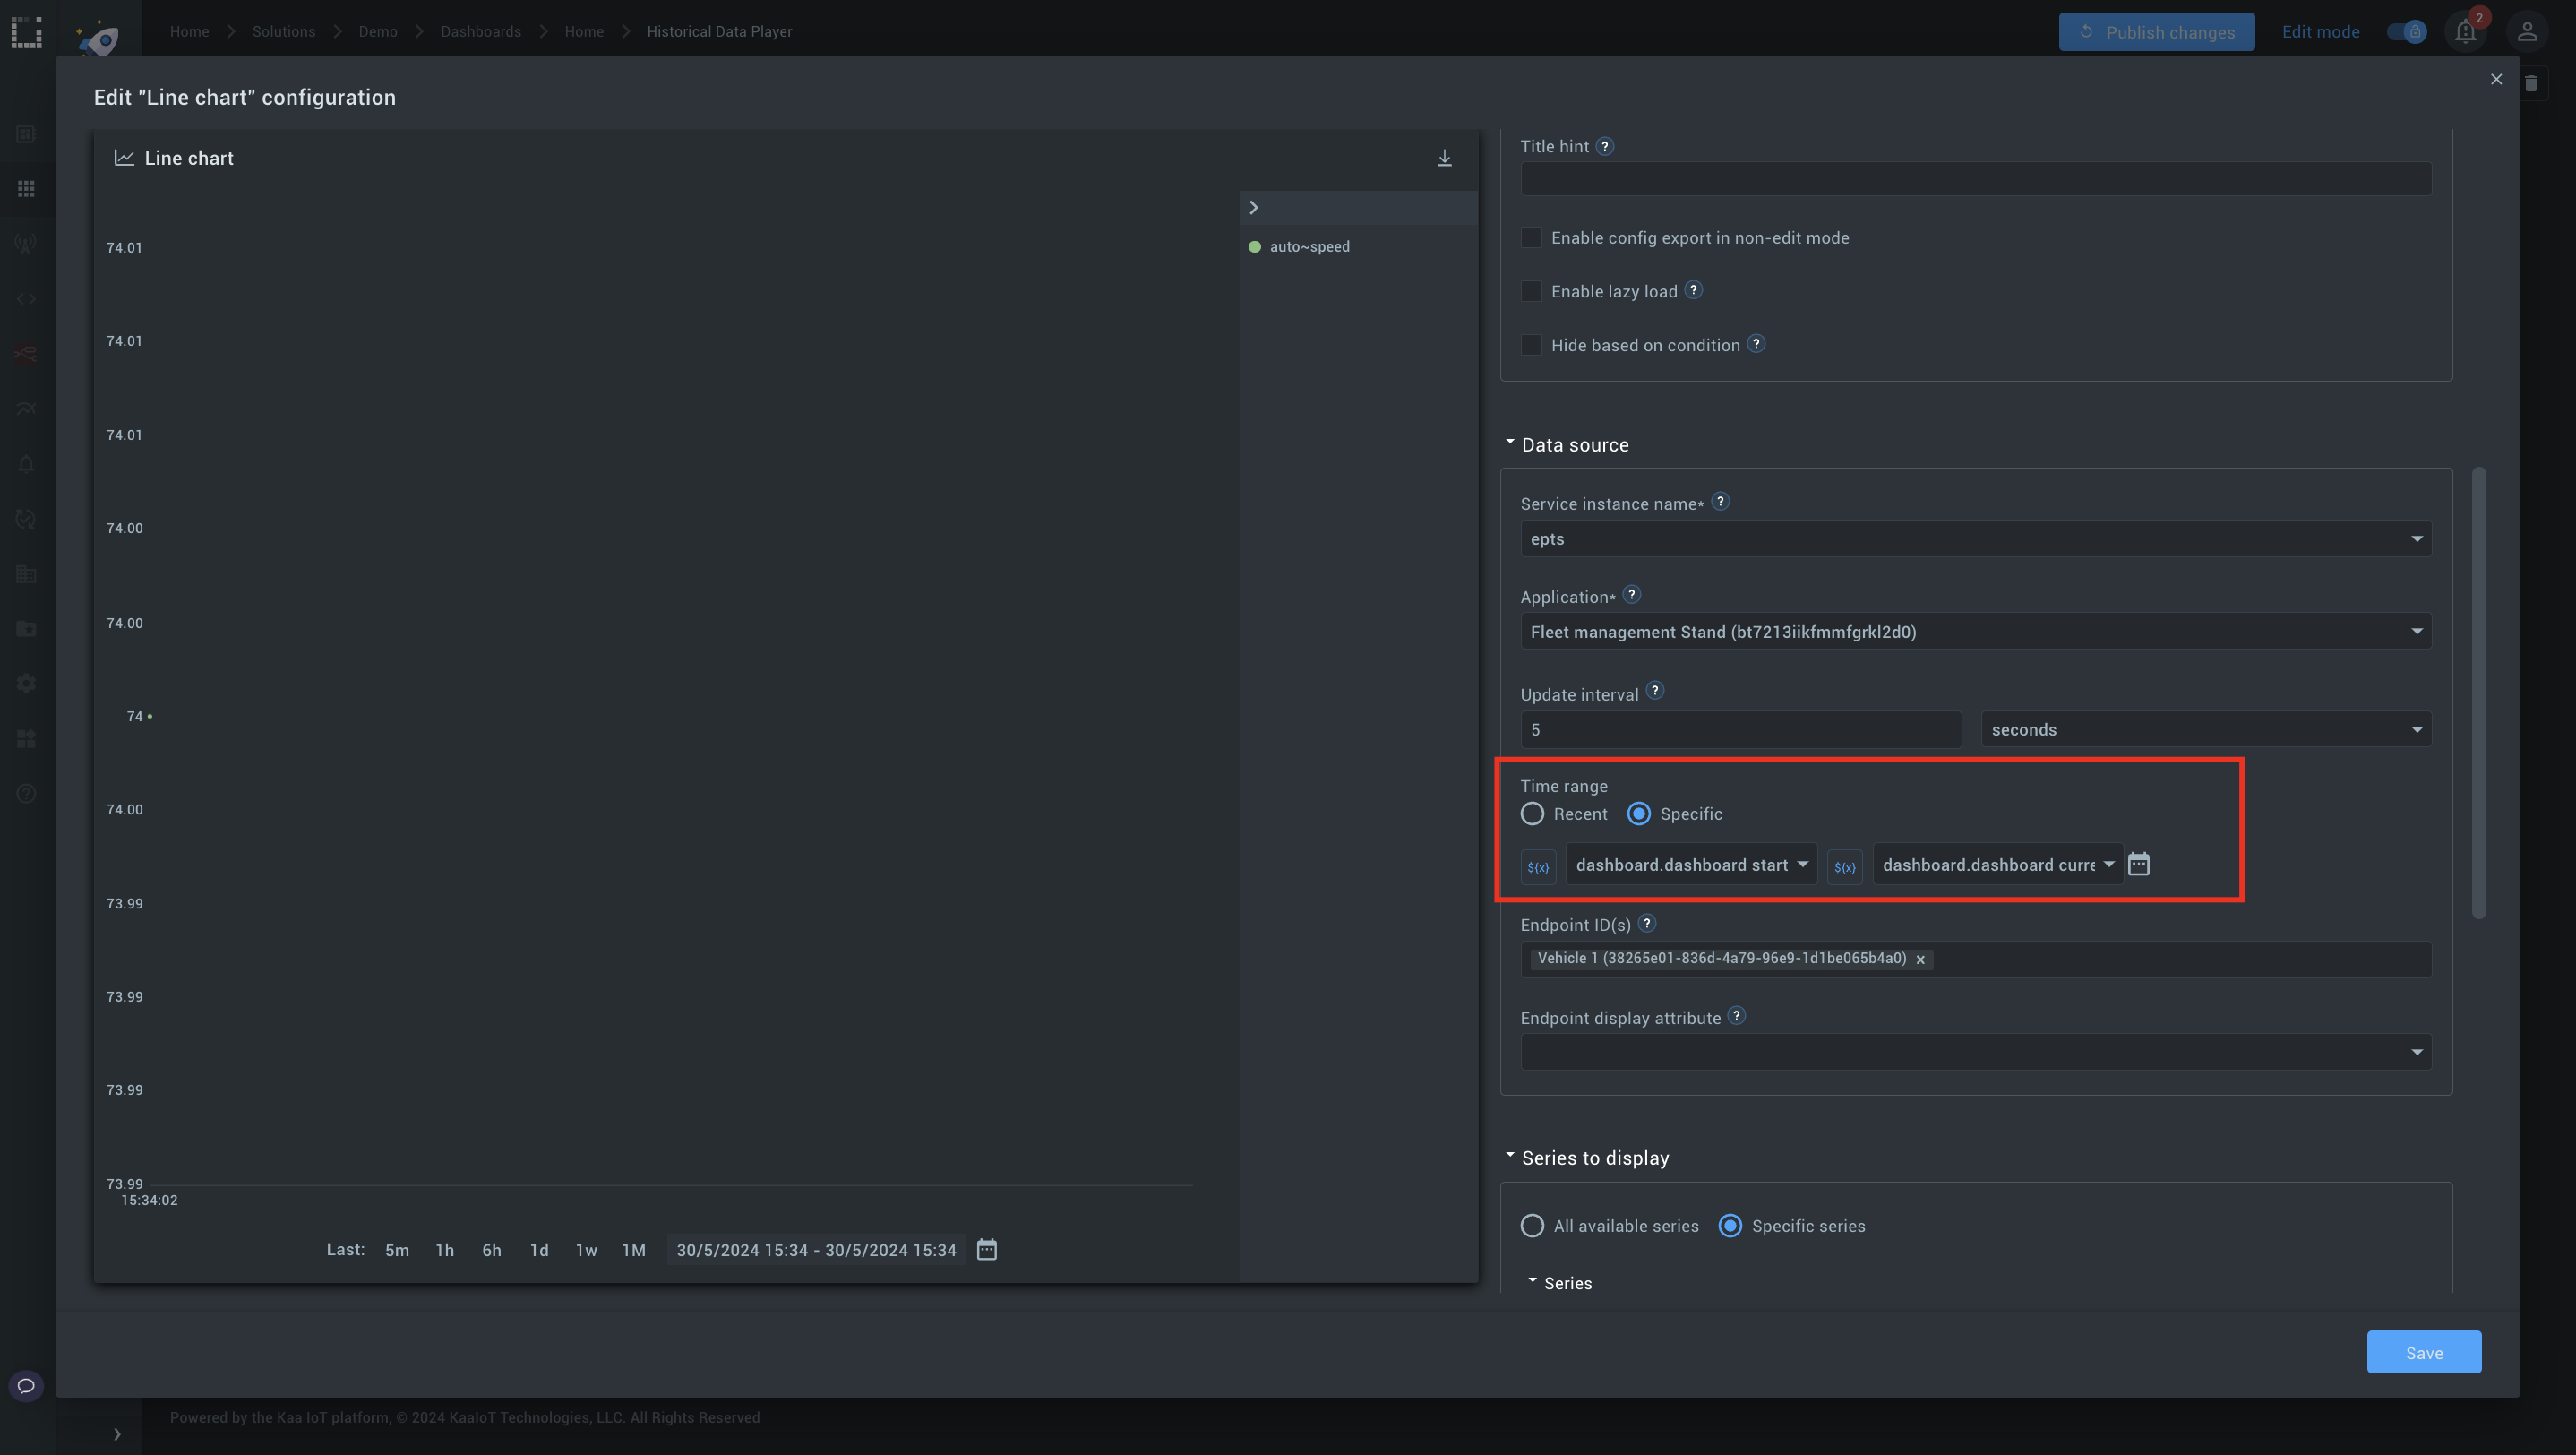
Play the timeline and observe the chart updating in real time.
#3. Combining the history player with a map widget
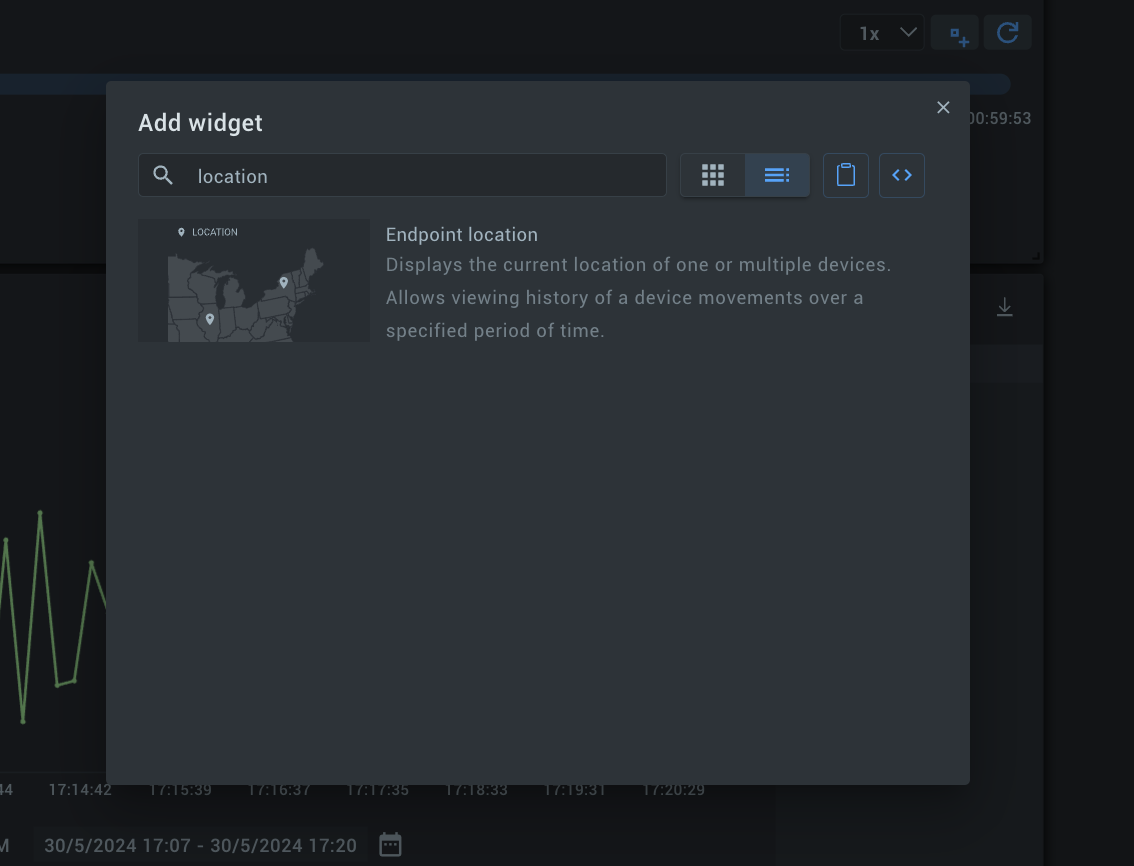
Step 1: Add a Map widget.
1. Add an Endpoint location widget to your dashboard.
2. Resize and position the widget as needed.
3. Configure the map
- Specify your application.
- Use data from: “Time series”
- Choose the relevant time series data (e.g., location data with latitude and longitude).
- Fill latitude and longitude values
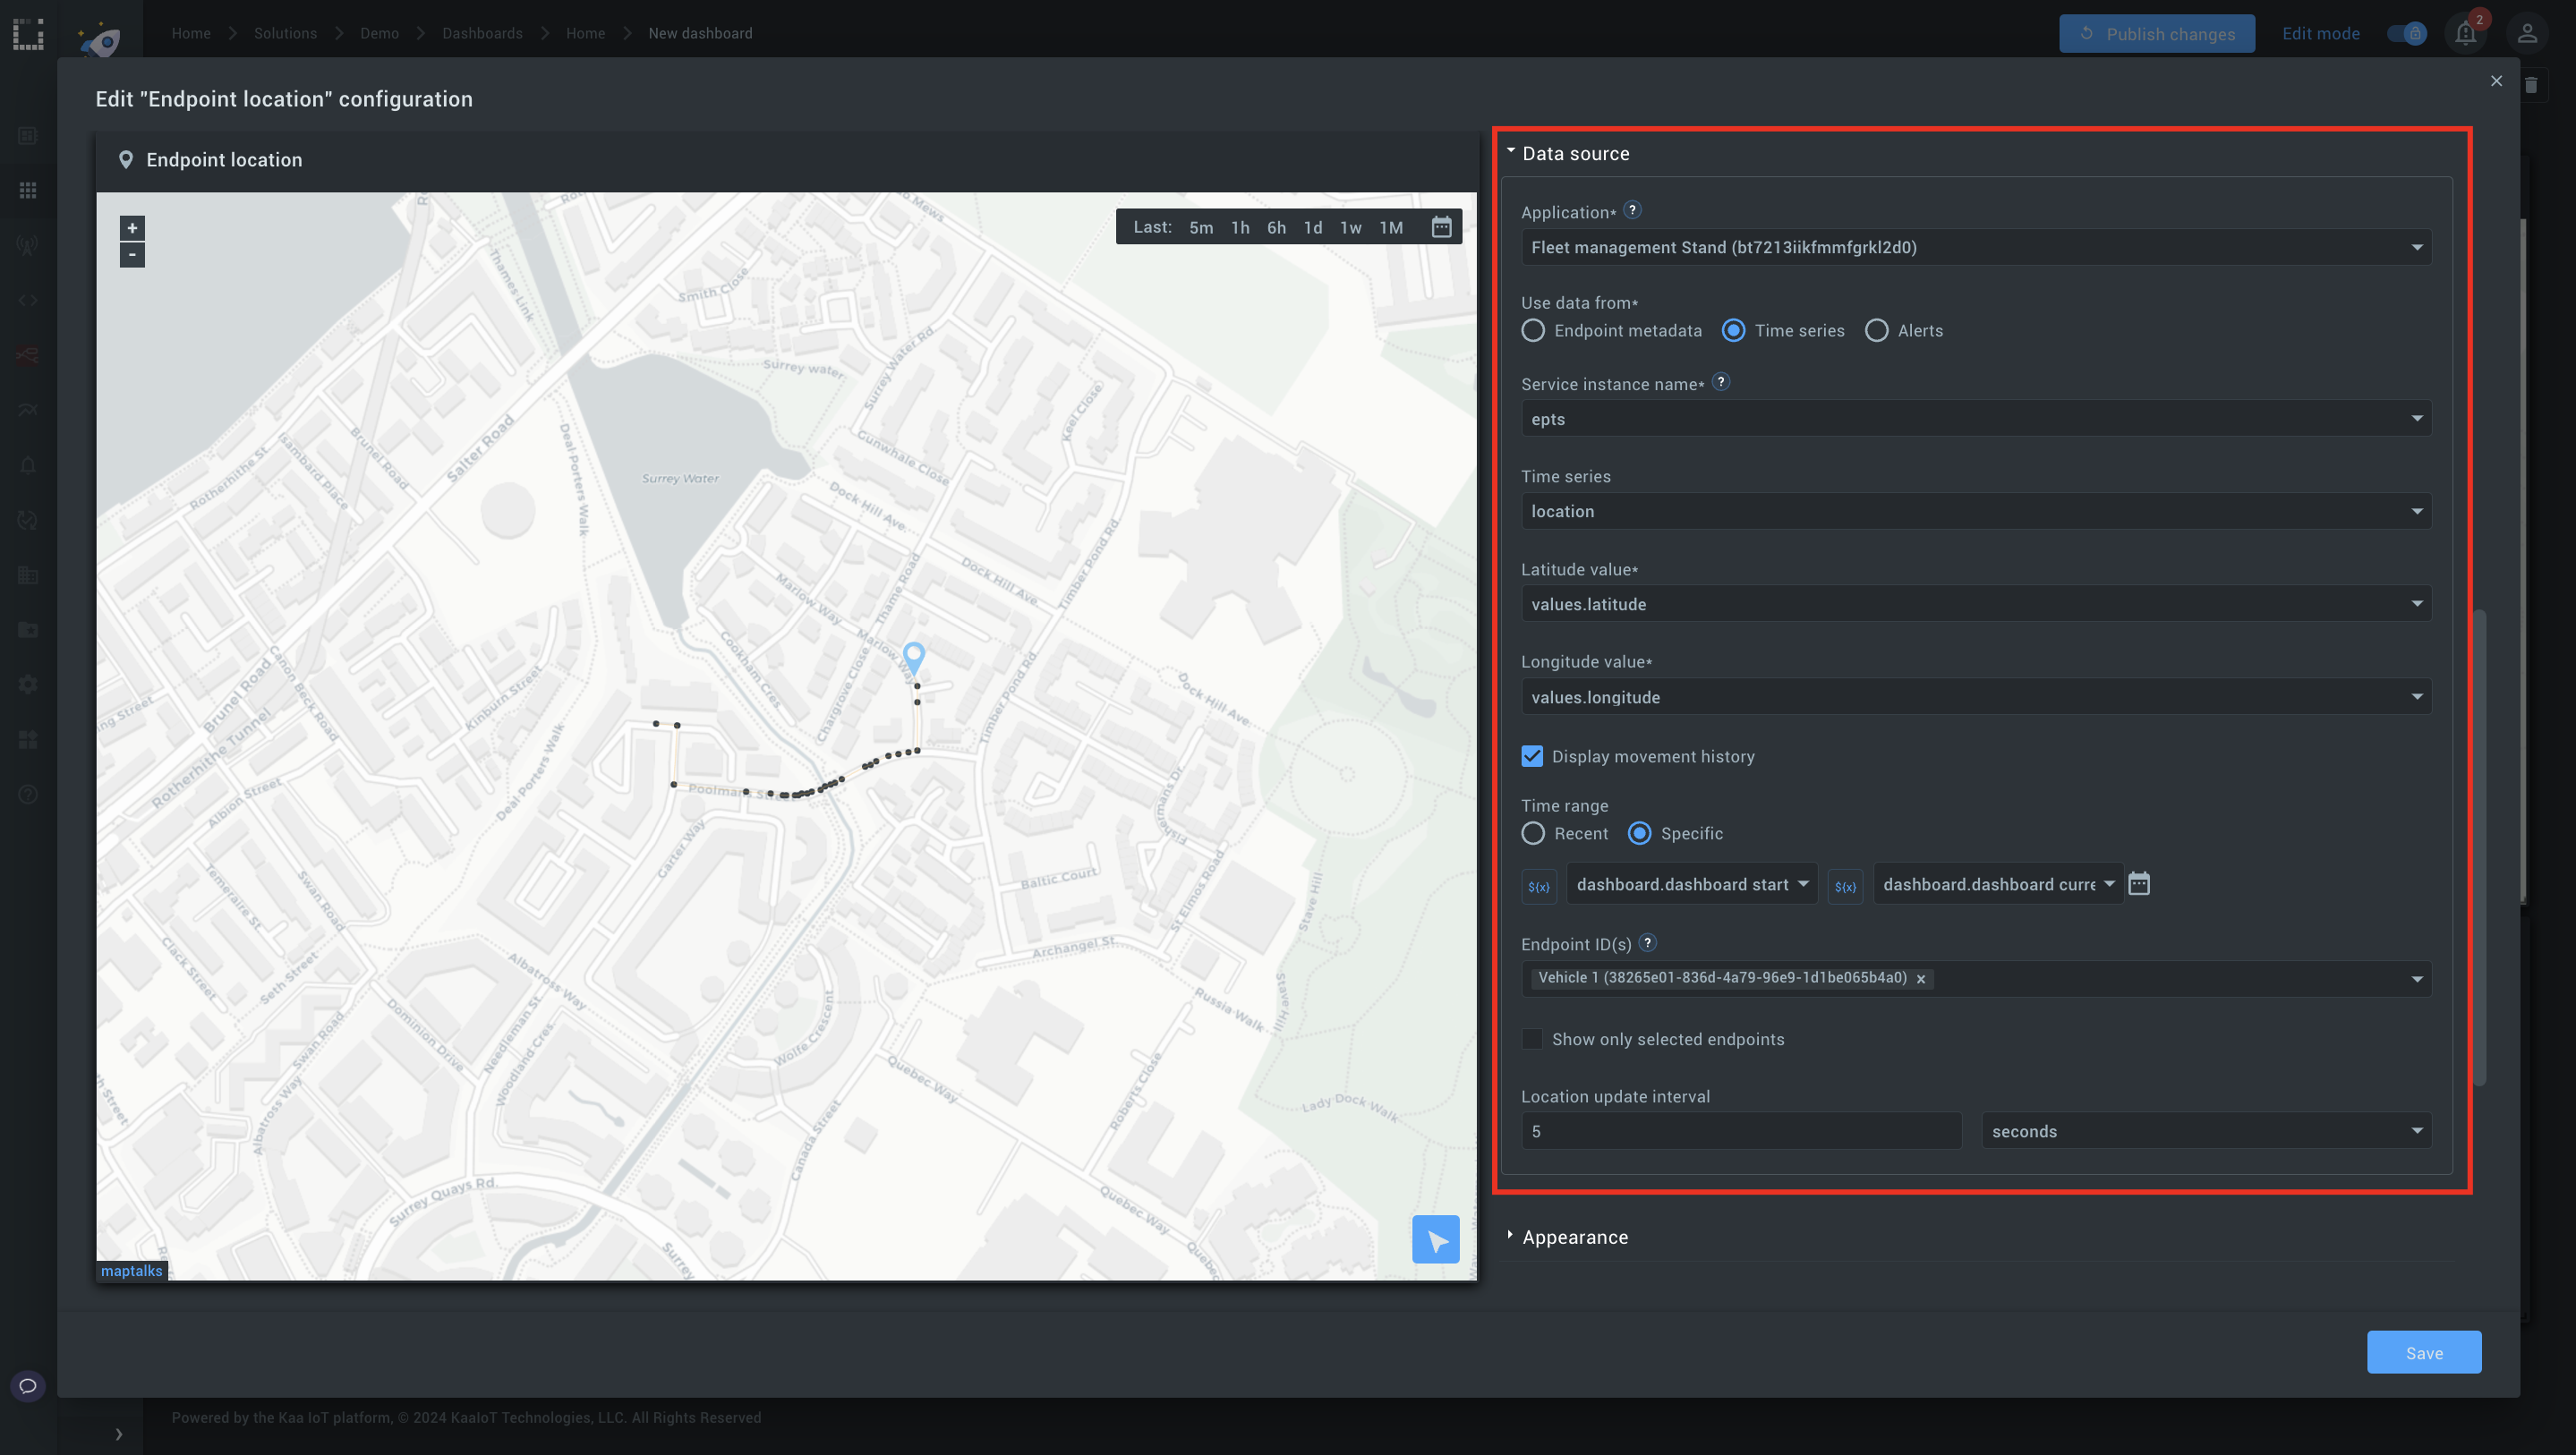
Step 2: Link to the history player.
- Tick Display movement history, choose Specific Time range, and specify the start date and the end date (the same as in Step 1).
- Play the timeline and watch the markers move along the route.
Conclusion
This tutorial provides a comprehensive overview of the Kaa IoT platform's history player widget and its functionality. By following the step-by-step instructions, users can effectively add and configure the history player widget, combining it with other widgets like time series charts and maps to visualize and analyze history data.
The tutorial demonstrated how to generate and configure timelines, customize playback speed, and use widget output to update variables dynamically. Additionally, it showed how to create a cohesive and informative history data overview by integrating the history player widget with charts and maps, offering a detailed view of data trends and patterns over time.
Stay tuned for more tutorials on how to maximize the potential of the Kaa IoT platform and leverage its powerful tools for your IoT solutions.
Related Stories
In this guide, we will connect the TEKTELIC VIVID LORAWAN® SMART ROOM & OCCUPANCY SENSOR...

Explore the features of the TEKTELIC COMFORT LoRaWAN Smart Room sensor in this tutorial...
TEKTELIC BREEZE and Kaa integration provides actionable insights...
Kaa Cloud enables file uploads directly from your IoT devices...