Step-by-Step Tutorial: Connecting TEKTELIC BREEZE to Kaa
In this tutorial, we'll take a look at the BREEZE Indoor Air Quality & CO2 Sensor from TEKTELIC, which is a LoRaWAN device used for monitoring indoor air quality. This device comes with multiple sensors that allow us to track:
- Temperature
- Humidity
- Light intensity
- Barometric air pressure
- CO2 concentration
The integration of multiple sensors into a single device is a significant advantage compared to similar devices from other manufacturers. The device supports two connection interfaces: LoRaWAN and Bluetooth. The Bluetooth interface allows for the installation of a smart display in an office environment using the Bluetooth low-energy e-ink display by the same manufacturer, providing a convenient option for visual display of the measured parameters.
Step 1: Registering the TEKTELIC BREEZE in TTN
We'll start by connecting the BREEZE Indoor Air Quality & CO2 Sensor to the Kaa IoT platform. We will use The Things Stack to connect LoRaWAN devices to the platform.
1. Login to The Things Stack Console: If you don’t have an account on The Things Network (TTN), create one here.
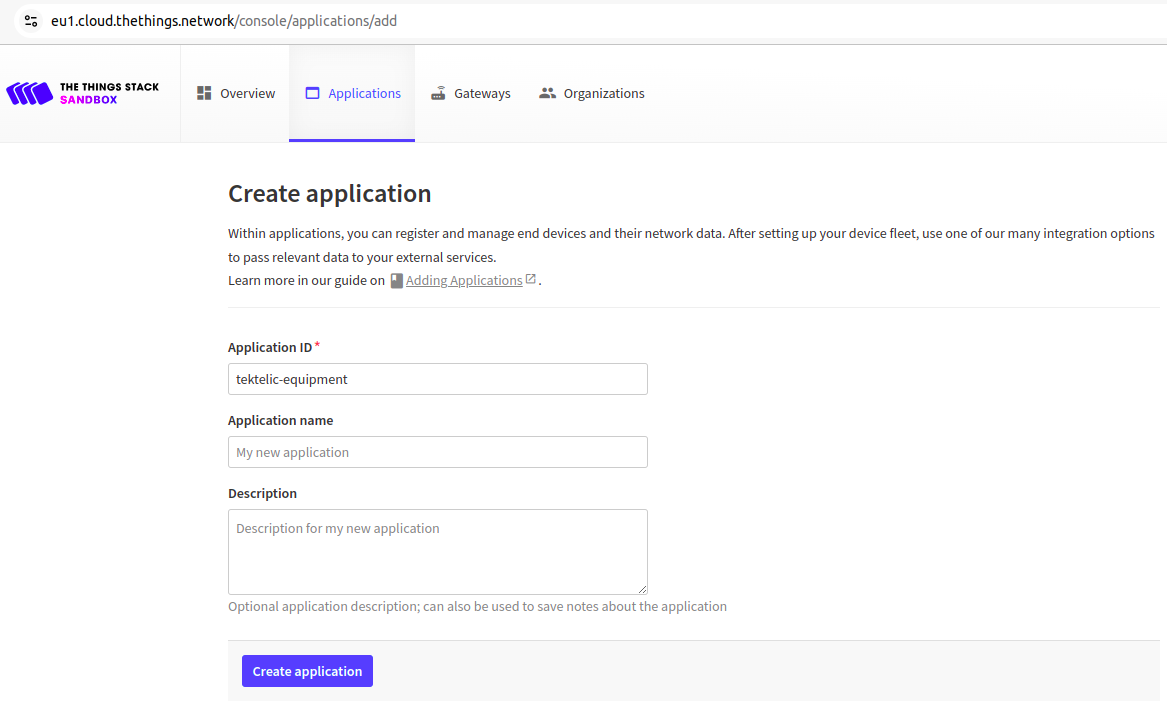
2. Create a new Application:
- Enter the Application ID and click the Create Application button.
3. Register the device:
- Go to the created application and register your device by clicking on Register end device.
There are two options for registering the device:
- Option 1: Select the end device from the LoRaWAN Device Repository of ready configurations. Please note that not all devices are present in this repository.
- Option 2: If the device is not in the repository, manually enter end device specifics.
The TEKTELIC BREEZE SENSOR is already in the repository, so we can simply select the device type and frequency plan.
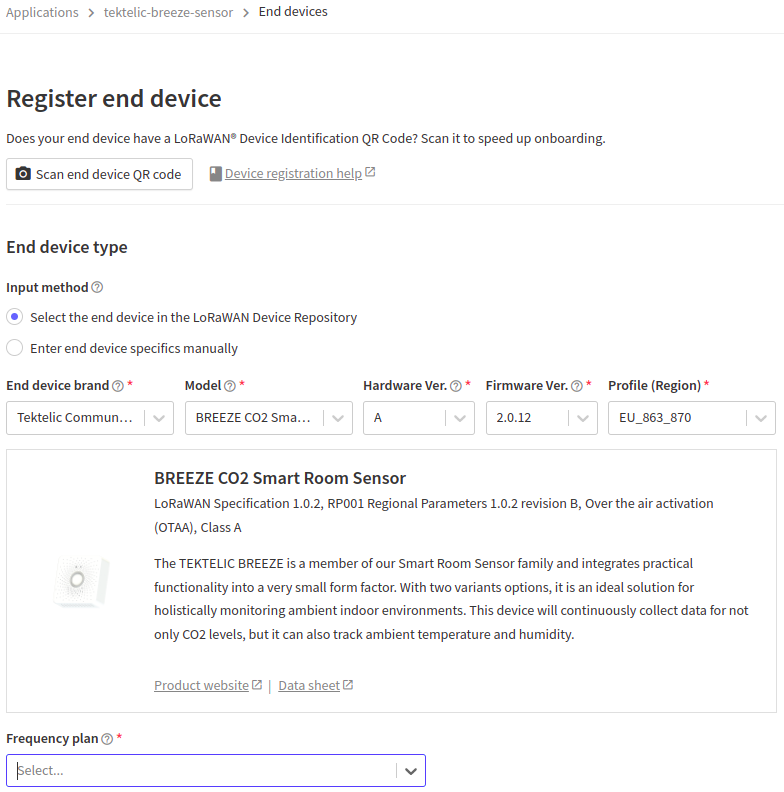
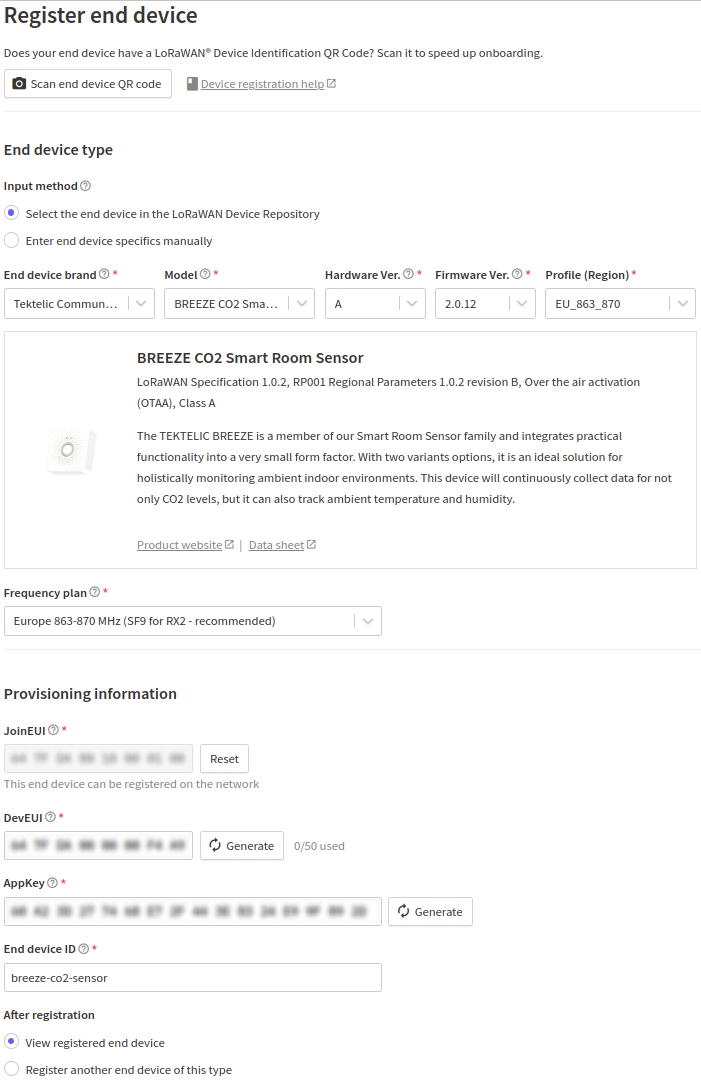
4. Choose Frequency plan
5. Enter LoRaWAN parameters:
- Enter JoinEUI, DevEUI & AppKey parameters. We can find these parameters on the device packaging. The data is available both in text form and via QR code. Let's use the QR code.
The device is successfully created!
6. Restart the device:
- Ensure that the batteries are installed and restart the device to connect it to TTN.
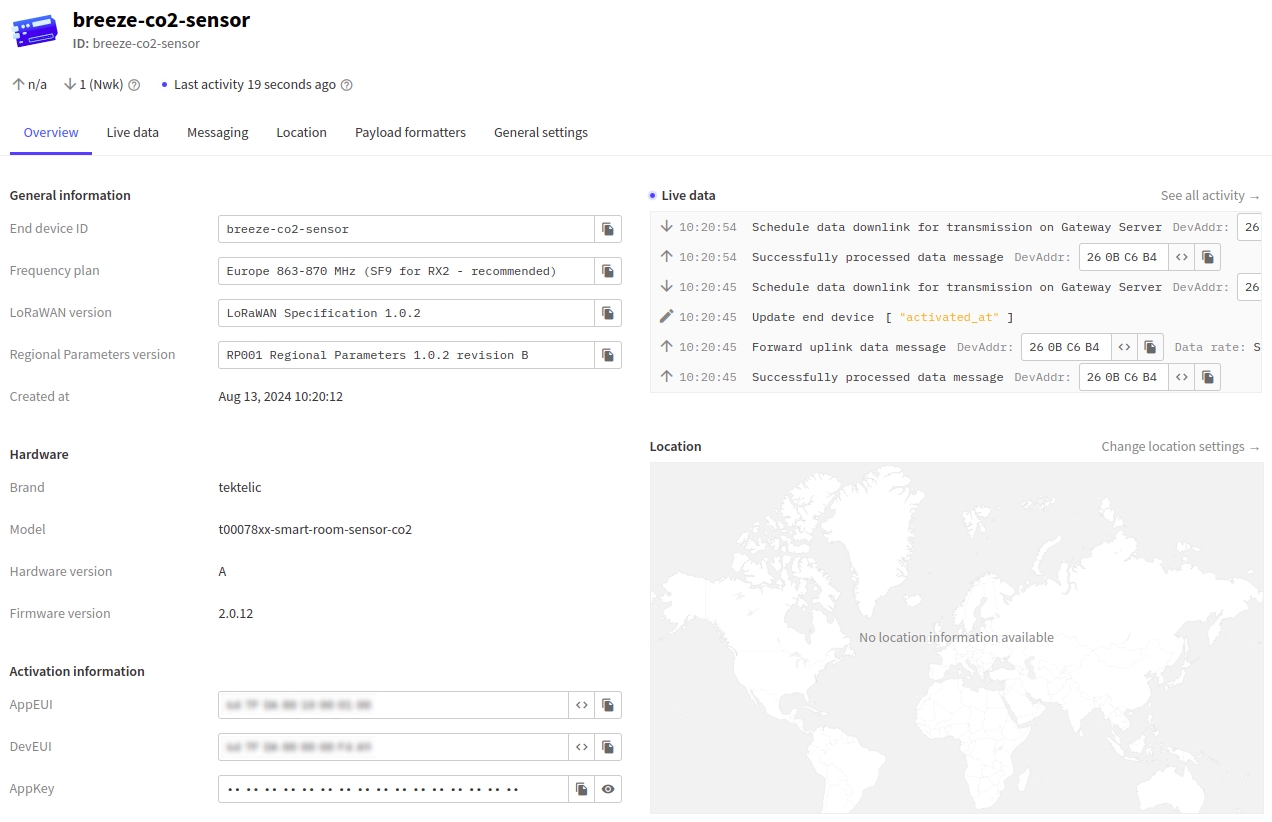
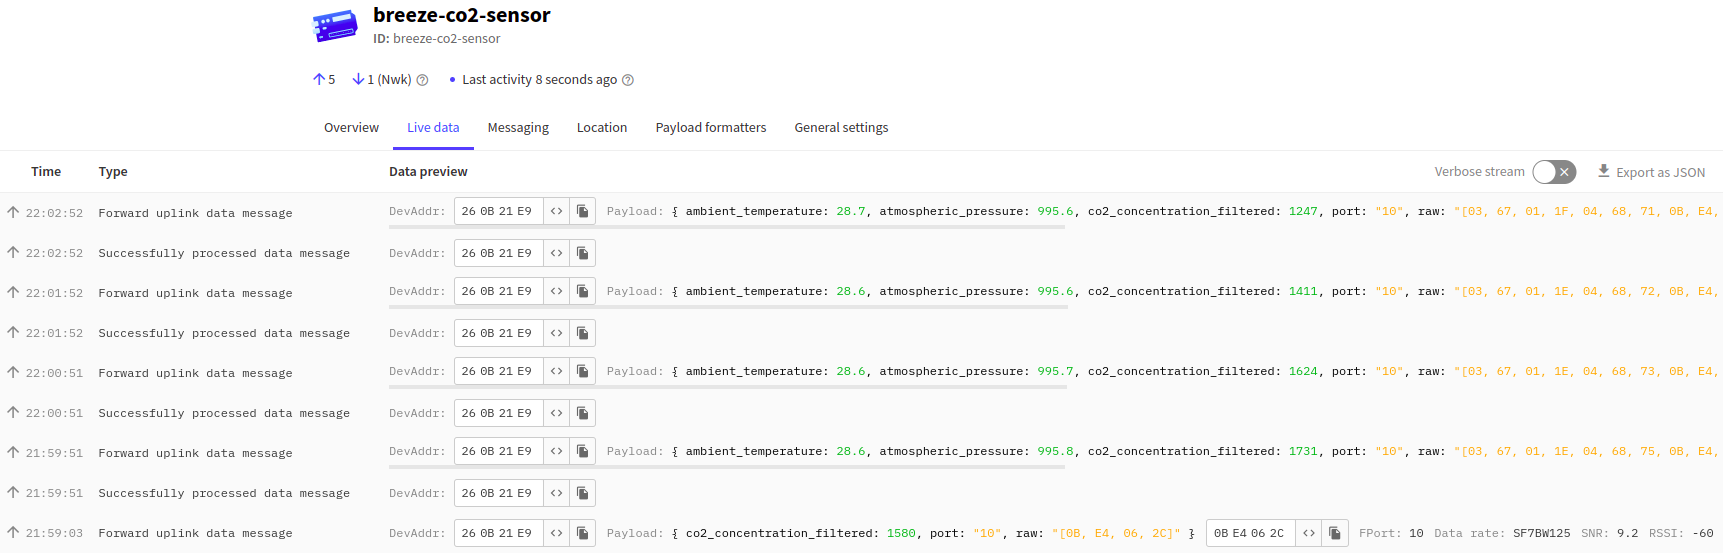
7. After successfully connecting the device to TTN and ensuring it’s sending data, let's take a closer look at what data the device sends:
Step 2: Integrating the Device with Kaa IoT Platform
The ability to connect LoRaWAN devices to the Kaa IoT platform is provided by creating application and device integrations (the concept is available here).
1. Create a new Application in Kaa:
- The first thing we need to do is to create an application in Kaa where the endpoints of the integrated LoRaWAN devices will be located. Let's call it tektelic-sensors.
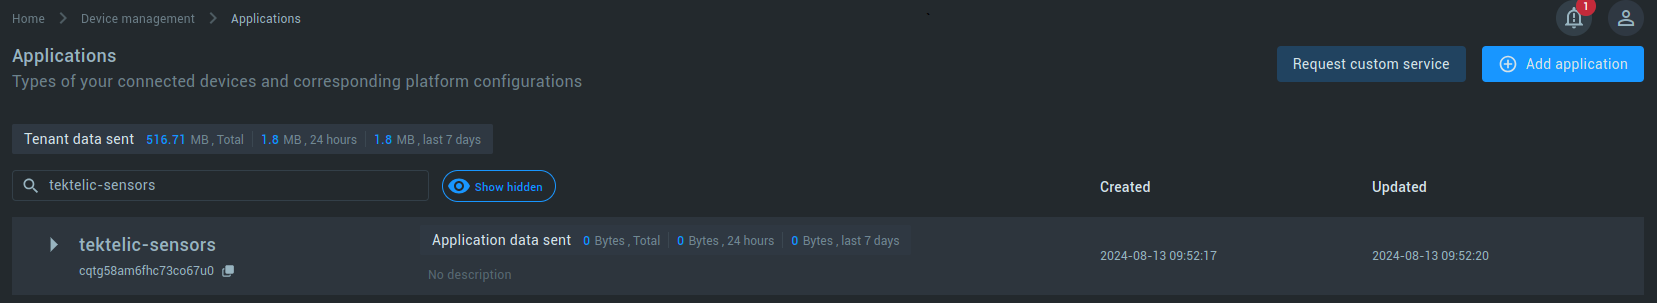
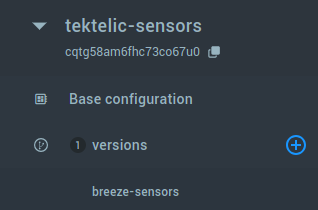
We can see that the application has been created and it already has one application version. It is good practice to place devices of different types in different application versions because they may have different features and sets of parameters.
- Let's rename the existing application version, e.g., breeze-sensors.
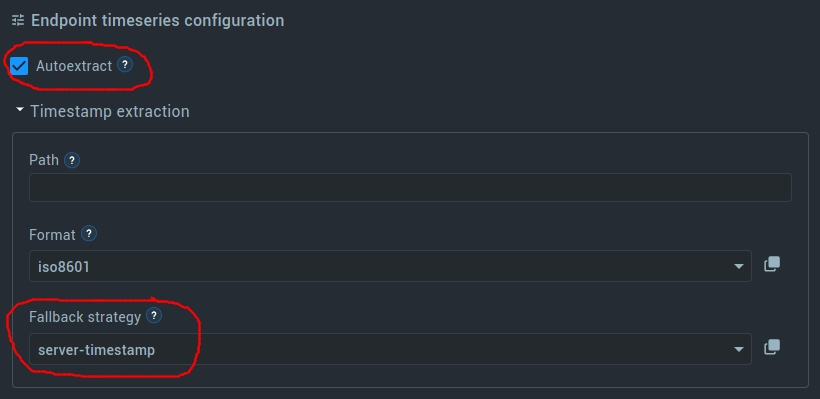
In order for digital data to be automatically extracted from messages coming from devices, we need to configure autoextract. More information can be found here.
2. Please make sure that the 'Autoextract' options are enabled in the EPTS application configuration for the Base application and in the application version.
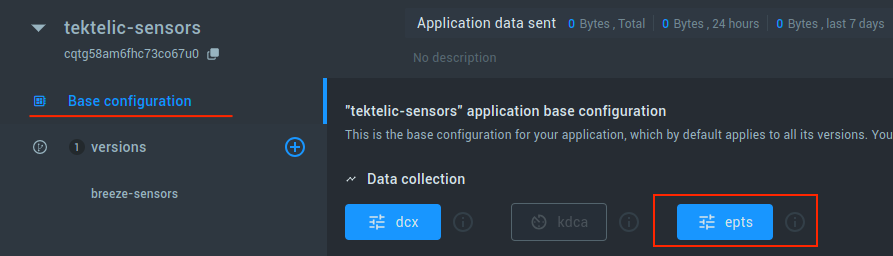
- Select Fallback strategy as server-timestamp and ensure Autoextract is selected.
Repeat the same operations for the breeze-sensors application version.
3. Navigate to the Integration Menu:
- Go to the LoRaWAN section and click on Add integration.
4. Fill in the Integration Details:
- Integration Name: Enter tektelic-sensors (in our case).
- Kaa Application Name: Select the previously created application from the list.
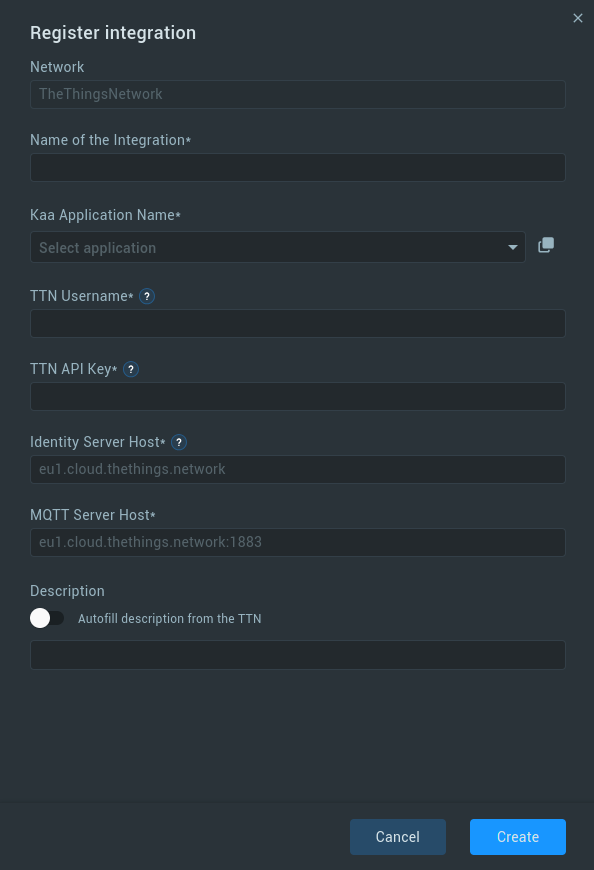
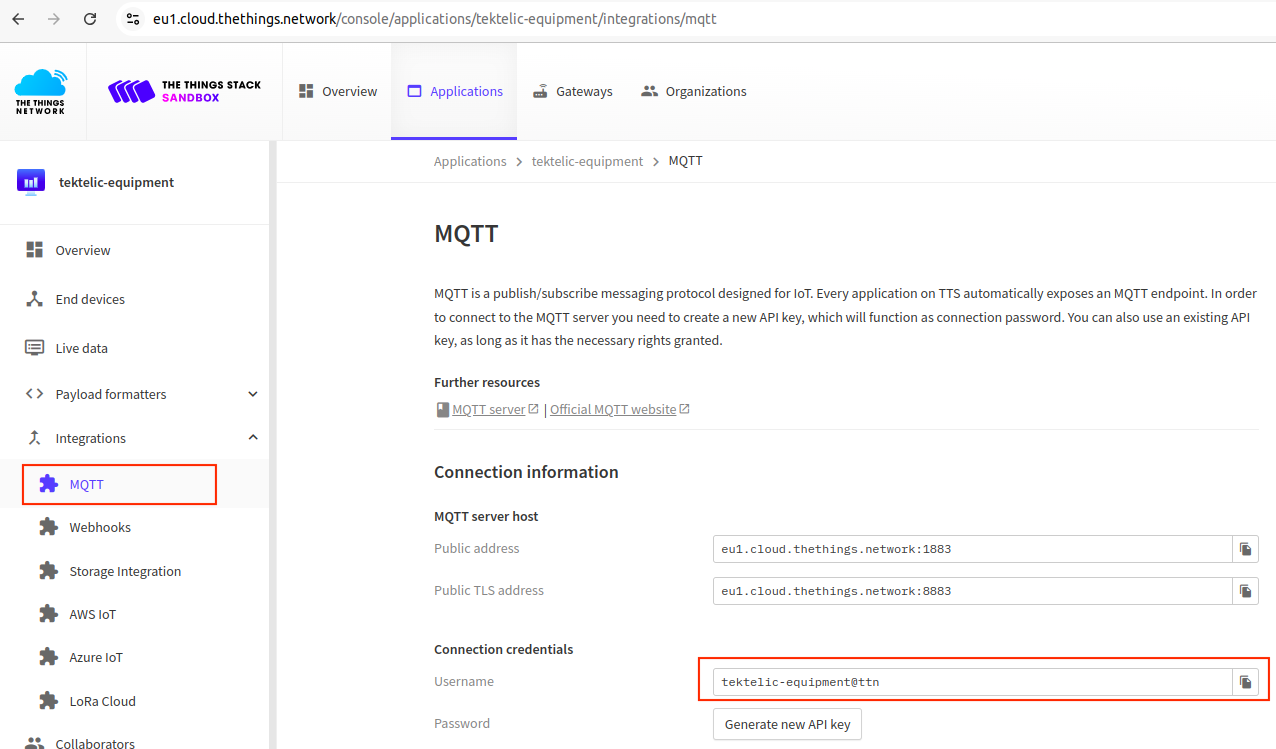
- TTN Username and TTN API Key: to get information for these fields go to your TTN account, navigate to the tektelic-equipment application, and click on Integrations / MQTT.
- Get Username and put it to the TTN Username of the form.
- Click Generate new API key to create a new key. Copy generated key to the TTN API Key of the form.
- In the Public address field, we can find the value for our integration registration field MQTT Server Host.
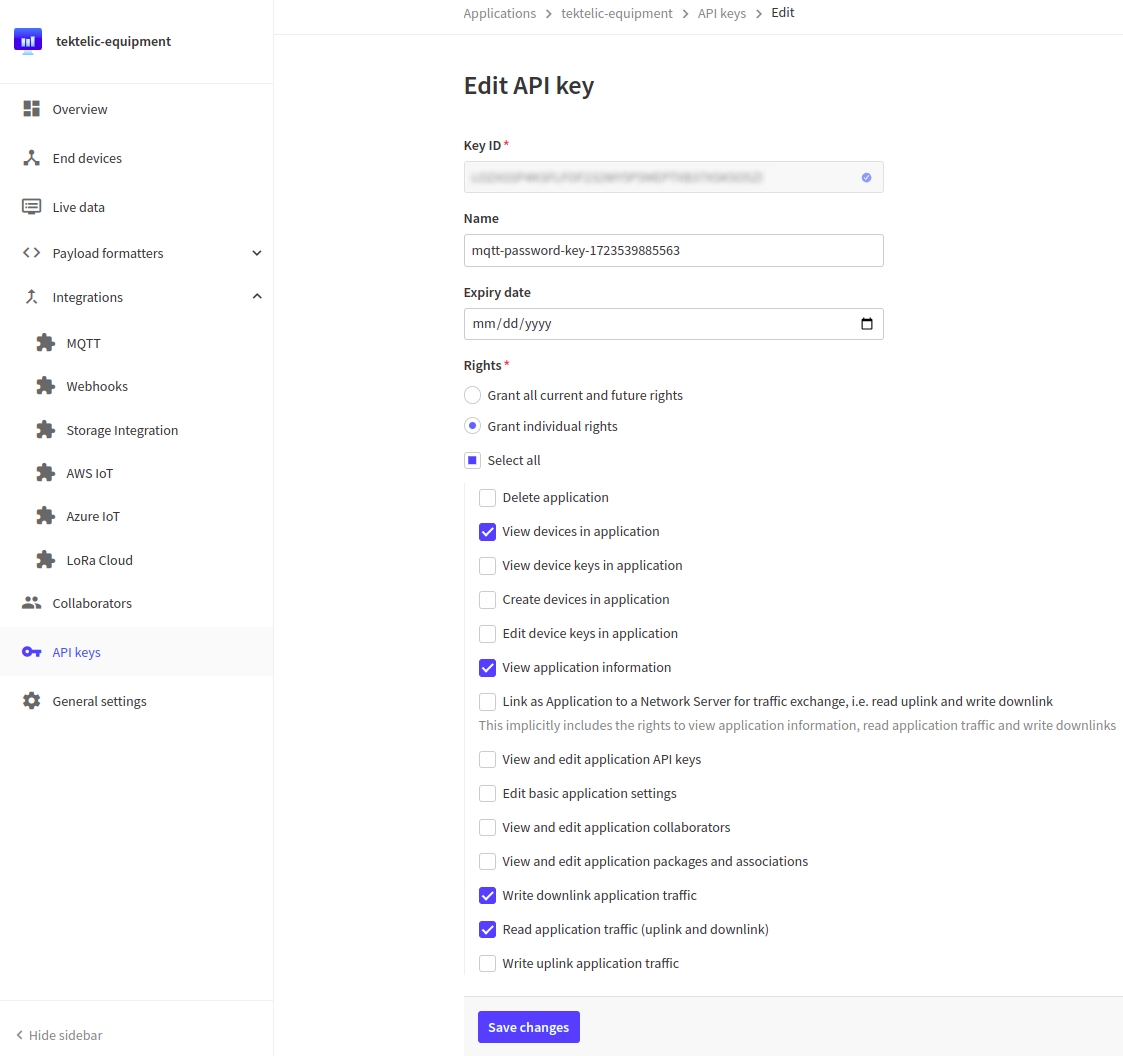
- Adjust API Key Permissions:
-
- Navigate to the API keys section and modify the access rights of the generated key.
- Ensure the key has permissions to read Uplink traffic, view devices, and access application information.
- Save the changes to confirm the integration setup.
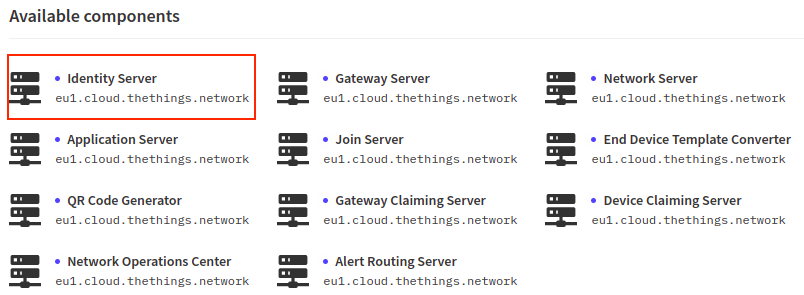
- Fill in Identity Server Host: go to the Overview section in TTN, and under Available components at the bottom of the screen, find the field labeled Identity Server Host.
5. Verify the Integration:
- To check the correctness of the Username and API key, click on the Autofill description from the TTN. This will request the Description field from TTN. If the field was left empty during application creation, it will remain empty here.
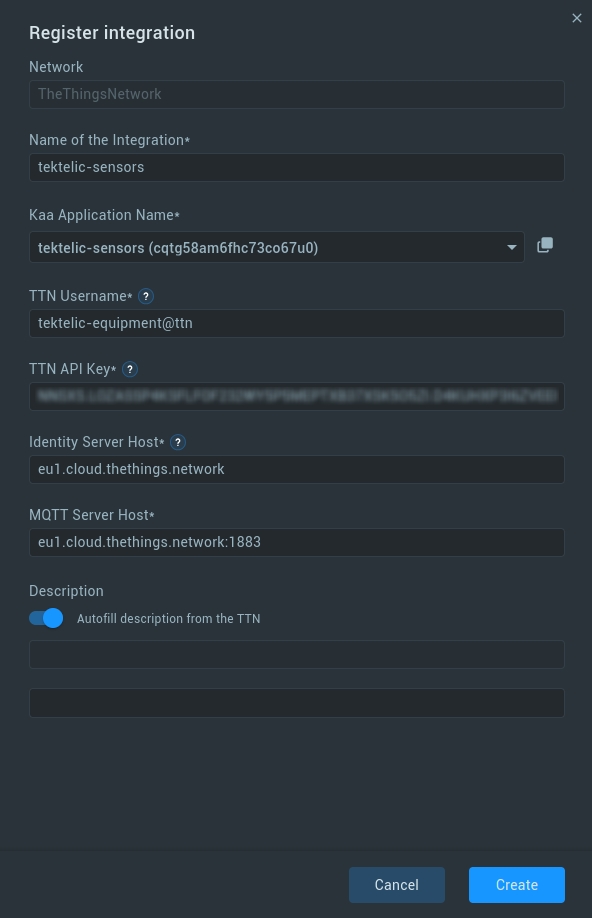
6. Finalize Integration:
- Click Create to complete the application integration.

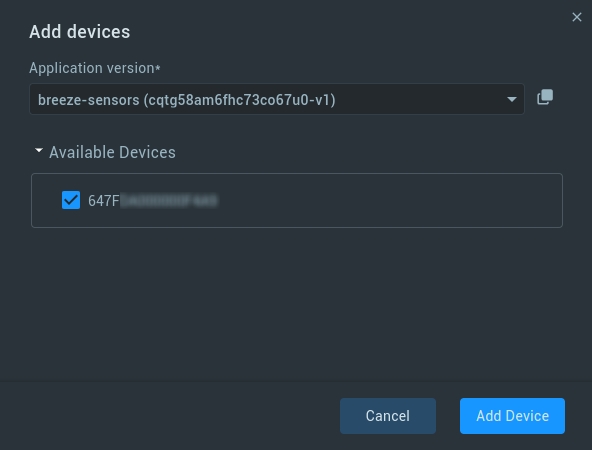
7. Add Devices:
- After creating the application integration, click on Add devices.
- You will see the EUI of the devices registered in TTN that are eligible for integration. In this case, there is only one device available.
8. Select Application Version:
- Choose the appropriate Application version where the endpoint associated with the device will be stored.
- Click Add Device.
9. Verify the Device Integration:
- Once the device has been added, you can see the created integration and the ID of the endpoint.
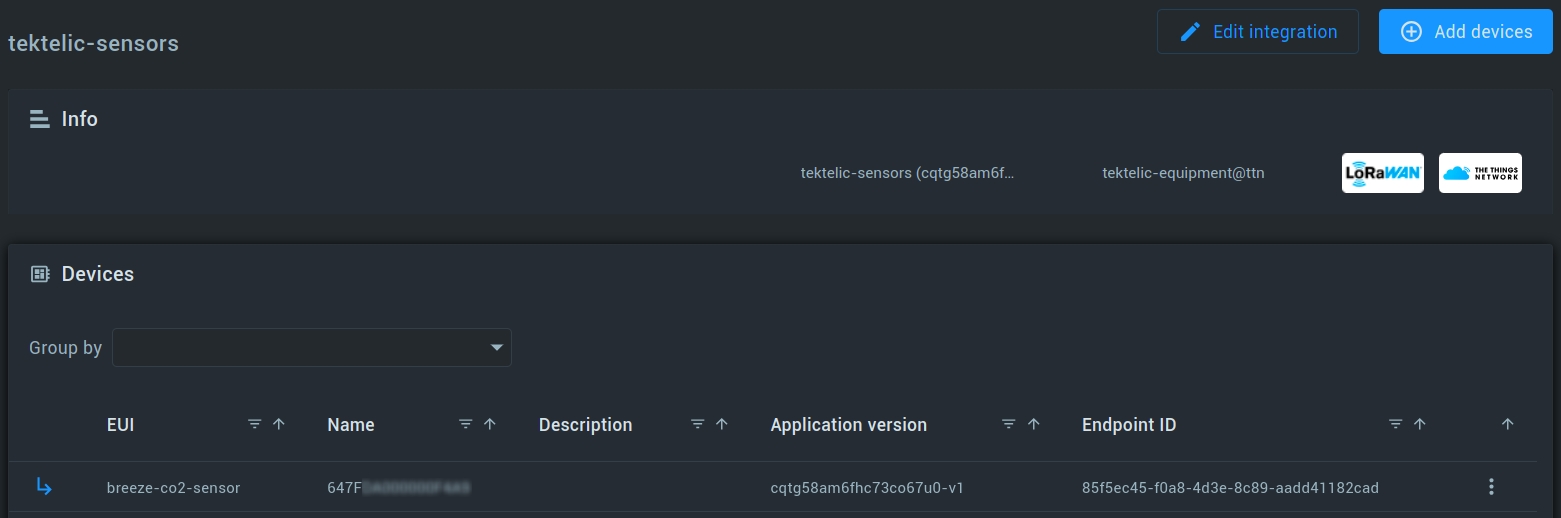
- Click on the created integration to go directly to the endpoint.
10. Check Data Reception:
- If the setup is correct, you will see data from the device.
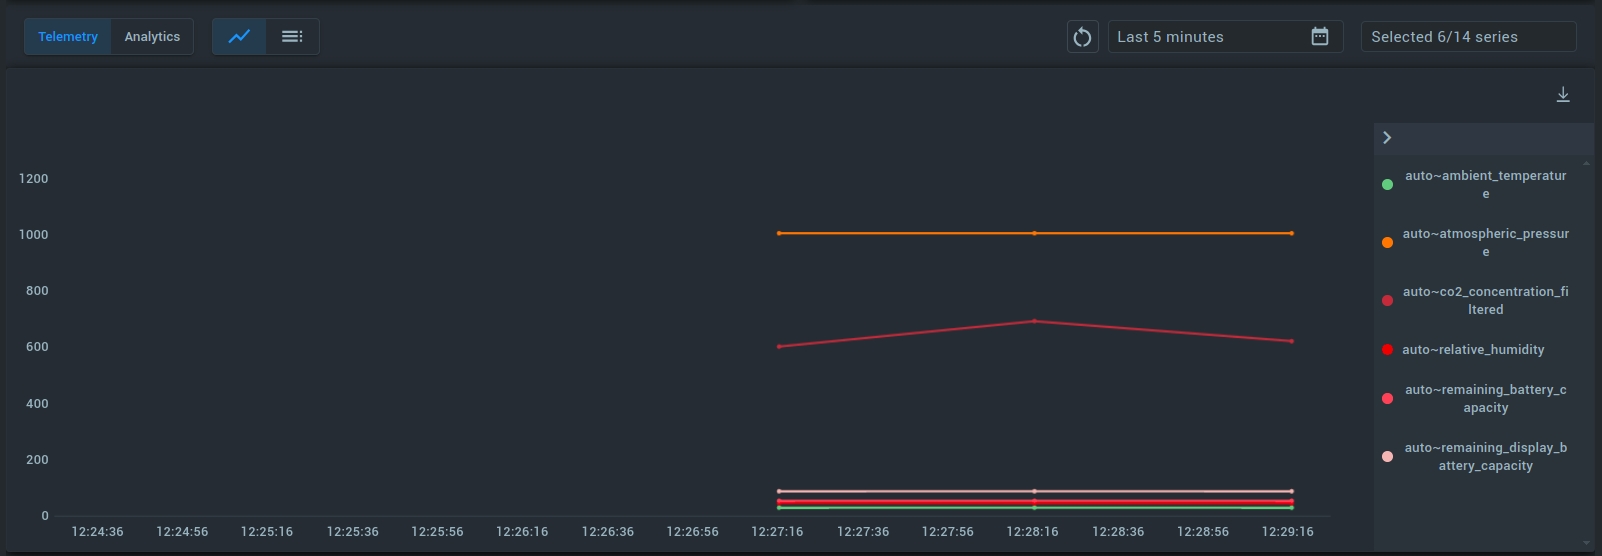
Troubleshooting: If data is not being received, ensure that Autoextract is properly configured for both the application and the application version, as described earlier.
Step 3: Setting Up a Simple Dashboard
1. Create a Solution:
- Go to the Solutions menu and select the solution created for tektelic-sensors.
- In the tektelic-sensors Solution, you will see the Home Dashboard. Click to enter.
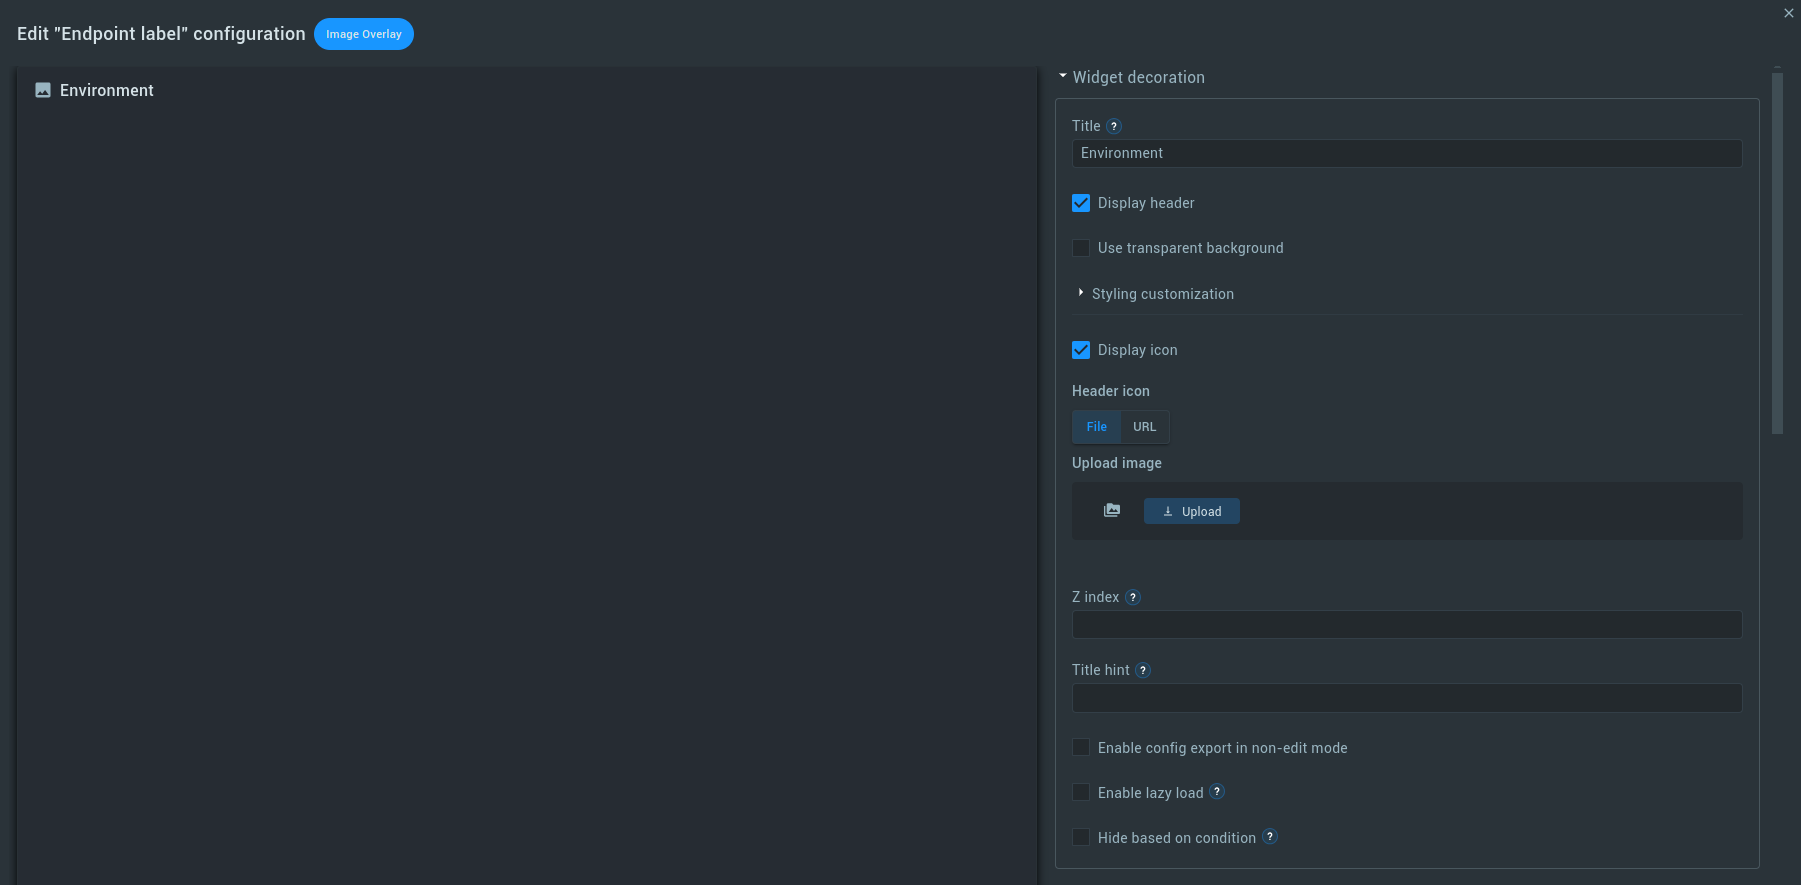
- Click Add widget and select the Endpoint Label widget type.
- Change the Title of the widget to Environment e.g.

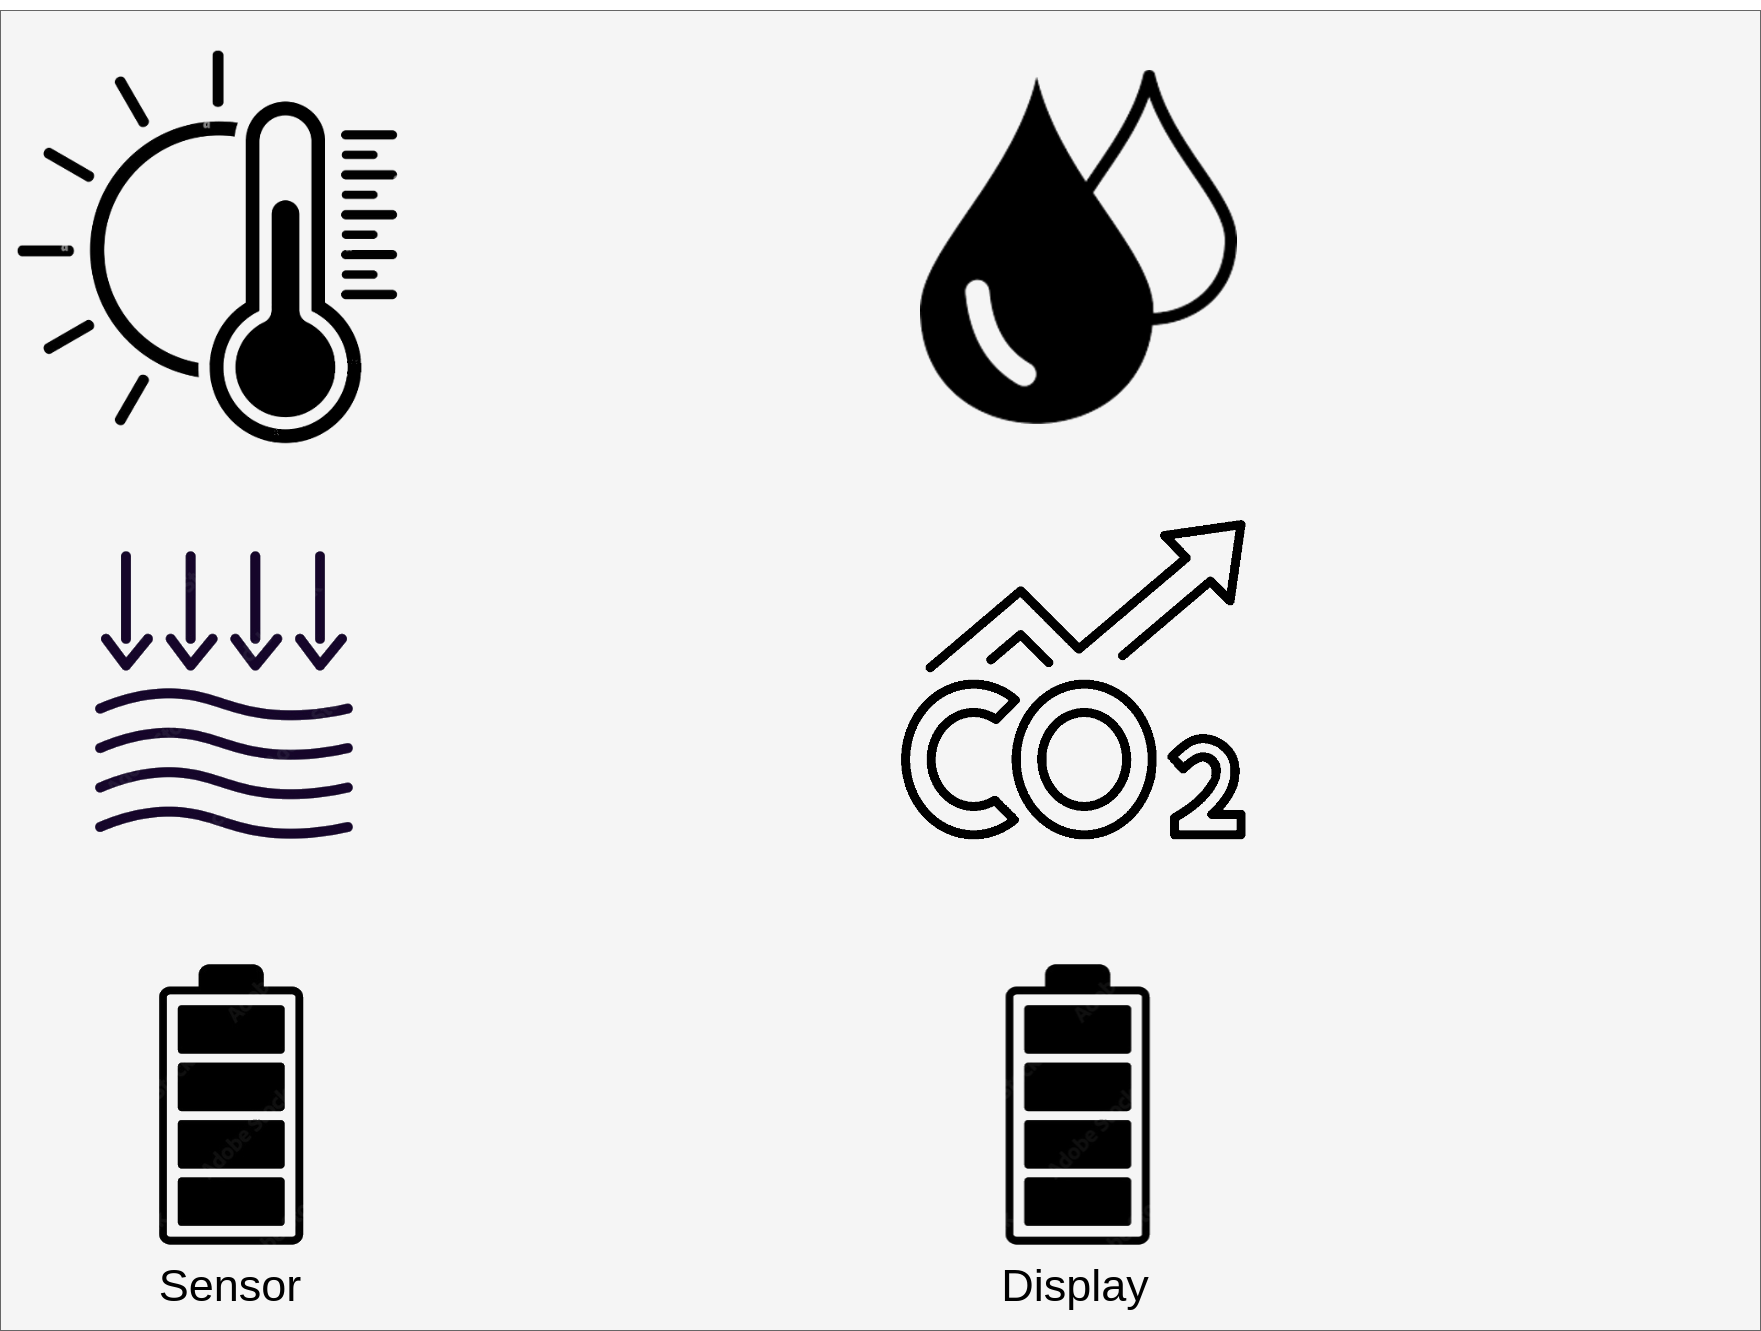
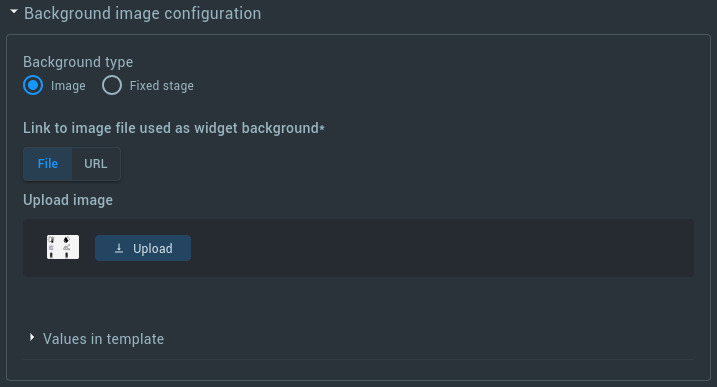
2. Set Up Background Image:
- You will need a background image, which can be created using icons and any graphic editor.
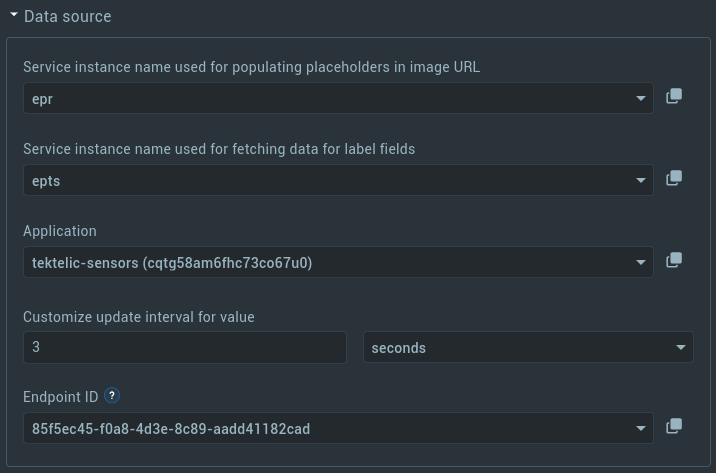
3. Configure the Data Source:
- In the Data source field, select the tektelic-sensors application and the corresponding endpoint ID.
4. Upload Background Image:
- Upload the image to be used as the widget’s background.
5. Add Time-Series Data:
- Begin by adding Temperature to the widget.
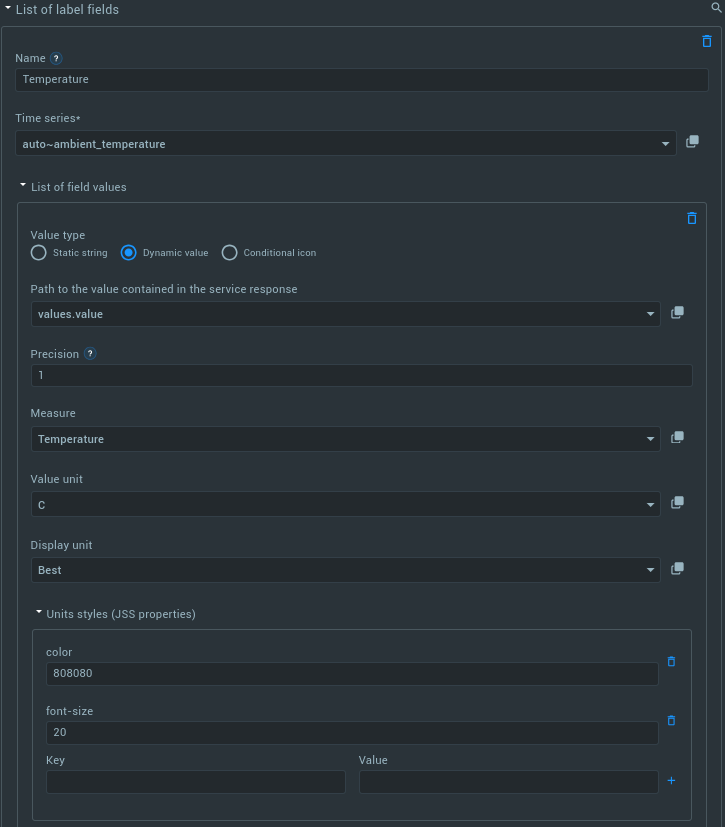
6. Configure Time-Series Settings:
- Time series: Choose the correct time series for temperature.
- Path to values: Define the path to the values contained in the service response.
- Precision: Configure the required precision.
- Units: Select the appropriate units of measurement.
- Unit Styles: Customize the style for the units.
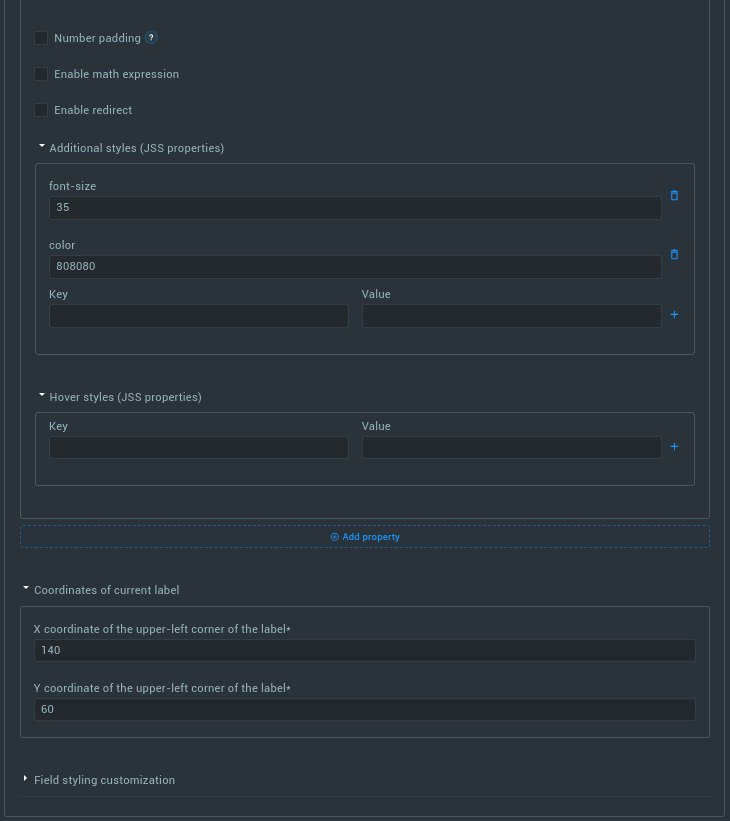
- Additional Styles: Set any additional styling options.
- Coordinates: Configure the coordinates to display the values on the image.
7. Complete the Widget:
- After configuring all the parameters, the widget will display the most recent data coming from the device.
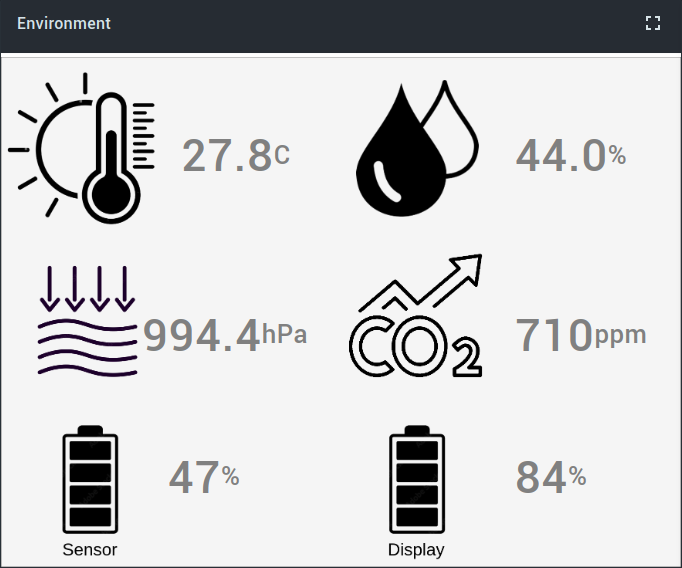
Example Widget Configuration:
(you will need to select the appropriate Application, Endpoint ID)
{
  "layout": {
    "x": 0,
    "y": 0,
    "w": 5,
    "h": 9,
    "minH": 3.5,
    "minW": 2
  },
  "config": {
    "header": {
      "stylingCustomization": {
        "textPlacement": "start",
        "headerBackgroundColor": "",
        "titleTextColor": "",
        "additionalStyles": {
          "title": {},
          "header": {}
        }
      },
      "displayTitle": true,
      "title": "Environment",
      "displayIcon": false
    },
    "serviceIntegration": {
      "metadataServiceName": "epr",
      "serviceName": "epts",
      "appName": "cqtg58am6fhc73co67u0",
      "updateInterval": 3000,
      "endpoint": "85f5ec45-f0a8-4d3e-8c89-aadd41182cad"
    },
    "backgroundImage": {
      "backgroundType": "image",
      "url": "https://minio.cloud.kaaiot.com/d29eeb91-131a-4831-b541-7b781201d6d4-public/__wd_resources/179ead69-148f-4f13-b246-8a61a7e6fa96.png",
      "values": [],
      "size": {
        "width": 300,
        "height": 300
      }
    },
    "fields": [
      {
        "timeSeriesName": "auto~ambient_temperature",
        "styling": {
          "color": "#9DB4BF",
          "fontSize": "5.714rem"
        },
        "coordinates": {
          "x1": "140",
          "y1": "60"
        },
        "values": [
          {
            "path": "values.value",
            "displayUnit": "Best",
            "displayScale": 1,
            "unitStyle": {
              "color": "808080",
              "font-size": "20"
            },
            "style": {
              "font-size": "35",
              "color": "808080"
            },
            "valueUnit": "C",
            "type": "path",
            "hoverStyles": {},
            "measure": "Temperature"
          }
        ],
        "name": "Temperature"
      },
      {
        "name": "Pressure",
        "values": [
          {
            "path": "values.value",
            "displayScale": 1,
            "unitStyle": {
              "color": "808080",
              "font-size": "20"
            },
            "style": {
              "font-size": "35",
              "color": "808080"
            },
            "displayPostfix": "hPa",
            "type": "path",
            "hoverStyles": {},
            "measure": "Custom"
          }
        ],
        "coordinates": {
          "x1": "130",
          "y1": "200"
        },
        "styling": {
          "redirectBlockPlacement": {},
          "additionalStyles": {}
        },
        "timeSeriesName": "auto~atmospheric_pressure"
      },
      {
        "name": "Humidity",
        "values": [
          {
            "path": "values.value",
            "displayScale": 1,
            "unitStyle": {
              "font-size": "20",
              "color": "808080"
            },
            "style": {
              "font-size": "35",
              "color": "808080"
            },
            "displayPostfix": "%",
            "type": "path",
            "hoverStyles": {},
            "measure": "Custom"
          }
        ],
        "coordinates": {
          "x1": "400",
          "y1": "60"
        },
        "styling": {
          "redirectBlockPlacement": {},
          "additionalStyles": {}
        },
        "timeSeriesName": "auto~relative_humidity"
      },
      {
        "name": "co2",
        "values": [
          {
            "path": "values.value",
            "displayScale": 0,
            "unitStyle": {
              "font-size": "20",
              "color": "808080"
            },
            "style": {
              "font-size": "35",
              "color": "808080"
            },
            "displayPostfix": "ppm",
            "type": "path",
            "hoverStyles": {},
            "measure": "Custom"
          }
        ],
        "coordinates": {
          "x1": "400",
          "y1": "200"
        },
        "styling": {
          "redirectBlockPlacement": {},
          "additionalStyles": {},
          "color": "#90EE90"
        },
        "timeSeriesName": "auto~co2_concentration_filtered"
      },
      {
        "name": "sensor battery",
        "values": [
          {
            "type": "path",
            "path": "values.value",
            "style": {
              "font-size": "35",
              "color": "808080"
            },
            "hoverStyles": {},
            "measure": "Custom",
            "displayPostfix": "%",
            "unitStyle": {
              "font-size": "20",
              "color": "808080"
            }
          }
        ],
        "coordinates": {
          "x1": "130",
          "y1": "310"
        },
        "styling": {
          "redirectBlockPlacement": {},
          "additionalStyles": {}
        },
        "timeSeriesName": "auto~remaining_battery_capacity"
      },
      {
        "name": "Display battery",
        "values": [
          {
            "type": "path",
            "path": "values.value",
            "style": {
              "font-size": "35",
              "color": "808080"
            },
            "hoverStyles": {},
            "measure": "Custom",
            "displayPostfix": "%",
            "unitStyle": {
              "font-size": "20",
              "color": "808080"
            }
          }
        ],
        "coordinates": {
          "x1": "400",
          "y1": "310"
        },
        "styling": {
          "redirectBlockPlacement": {},
          "additionalStyles": {}
        },
        "timeSeriesName": "auto~remaining_display_battery_capacity"
      }
    ],
    "appearance": {
      "contentFit": "container"
    },
    "type": "epLabel"
  },
  "lastUpdated": 1723545657626,
  "order": 0
}
Conclusion
Congratulations on successfully setting up and connecting your TEKTELIC BREEZE Indoor Air Quality & CO2 Sensor to the Kaa IoT platform! By following this tutorial, you’ve learned how to integrate a LoRaWAN device with Kaa, configure data sources, and create a custom dashboard to visualize your sensor data in real time.
This setup allows you to monitor important environmental parameters effectively, providing valuable insights into indoor air quality. Should you encounter any issues, revisit the steps outlined in this guide, particularly focusing on API key permissions, integration settings, and widget configurations, or contact us.
Thank you for following along, and enjoy your new sensor setup!
Related Stories
In this guide, we will connect the TEKTELIC VIVID LORAWAN® SMART ROOM & OCCUPANCY SENSOR...
Explore the features of the TEKTELIC COMFORT LoRaWAN Smart Room sensor in this tutorial...
Kaa Cloud enables file uploads directly from your IoT devices...

In this tutorial, we will go over the steps to set up alerts in the Kaa IoT platform...