Tracing and Debugging
- Introduction to Tracing and Debugging in Rule Engine
- Core Features Overview
- Tracing in Rule Engine
- Conclusion
Introduction to Tracing and Debugging in Rule Engine
When writing rules, whether they are simple ones with a single expression or more complex ones with multiple triggers and actions, it’s important to be able to check the behavior of your rule and troubleshot it if needed.
The Rule Engine provides basic tools for debugging and monitoring your rules.
In this article we will guide you through these tools and explain how to use them efficiently.
Core Features Overview
The main debugging tools in the Rule Engine are:
- The tracing feature, which allows you to monitor logs generated by
rules. - The custom
console.logmethod, which you can use within your JavaScript code. More on this later.
Before moving forward, check out the Getting Started guide. In this article, we’ll use the rule from that guide and simulate data output through device → data publish, as explained there.
Tracing in Rule Engine
To monitor the behavior of your rule, navigate to Rules → Tracing. Here’s a simple description of the UI:
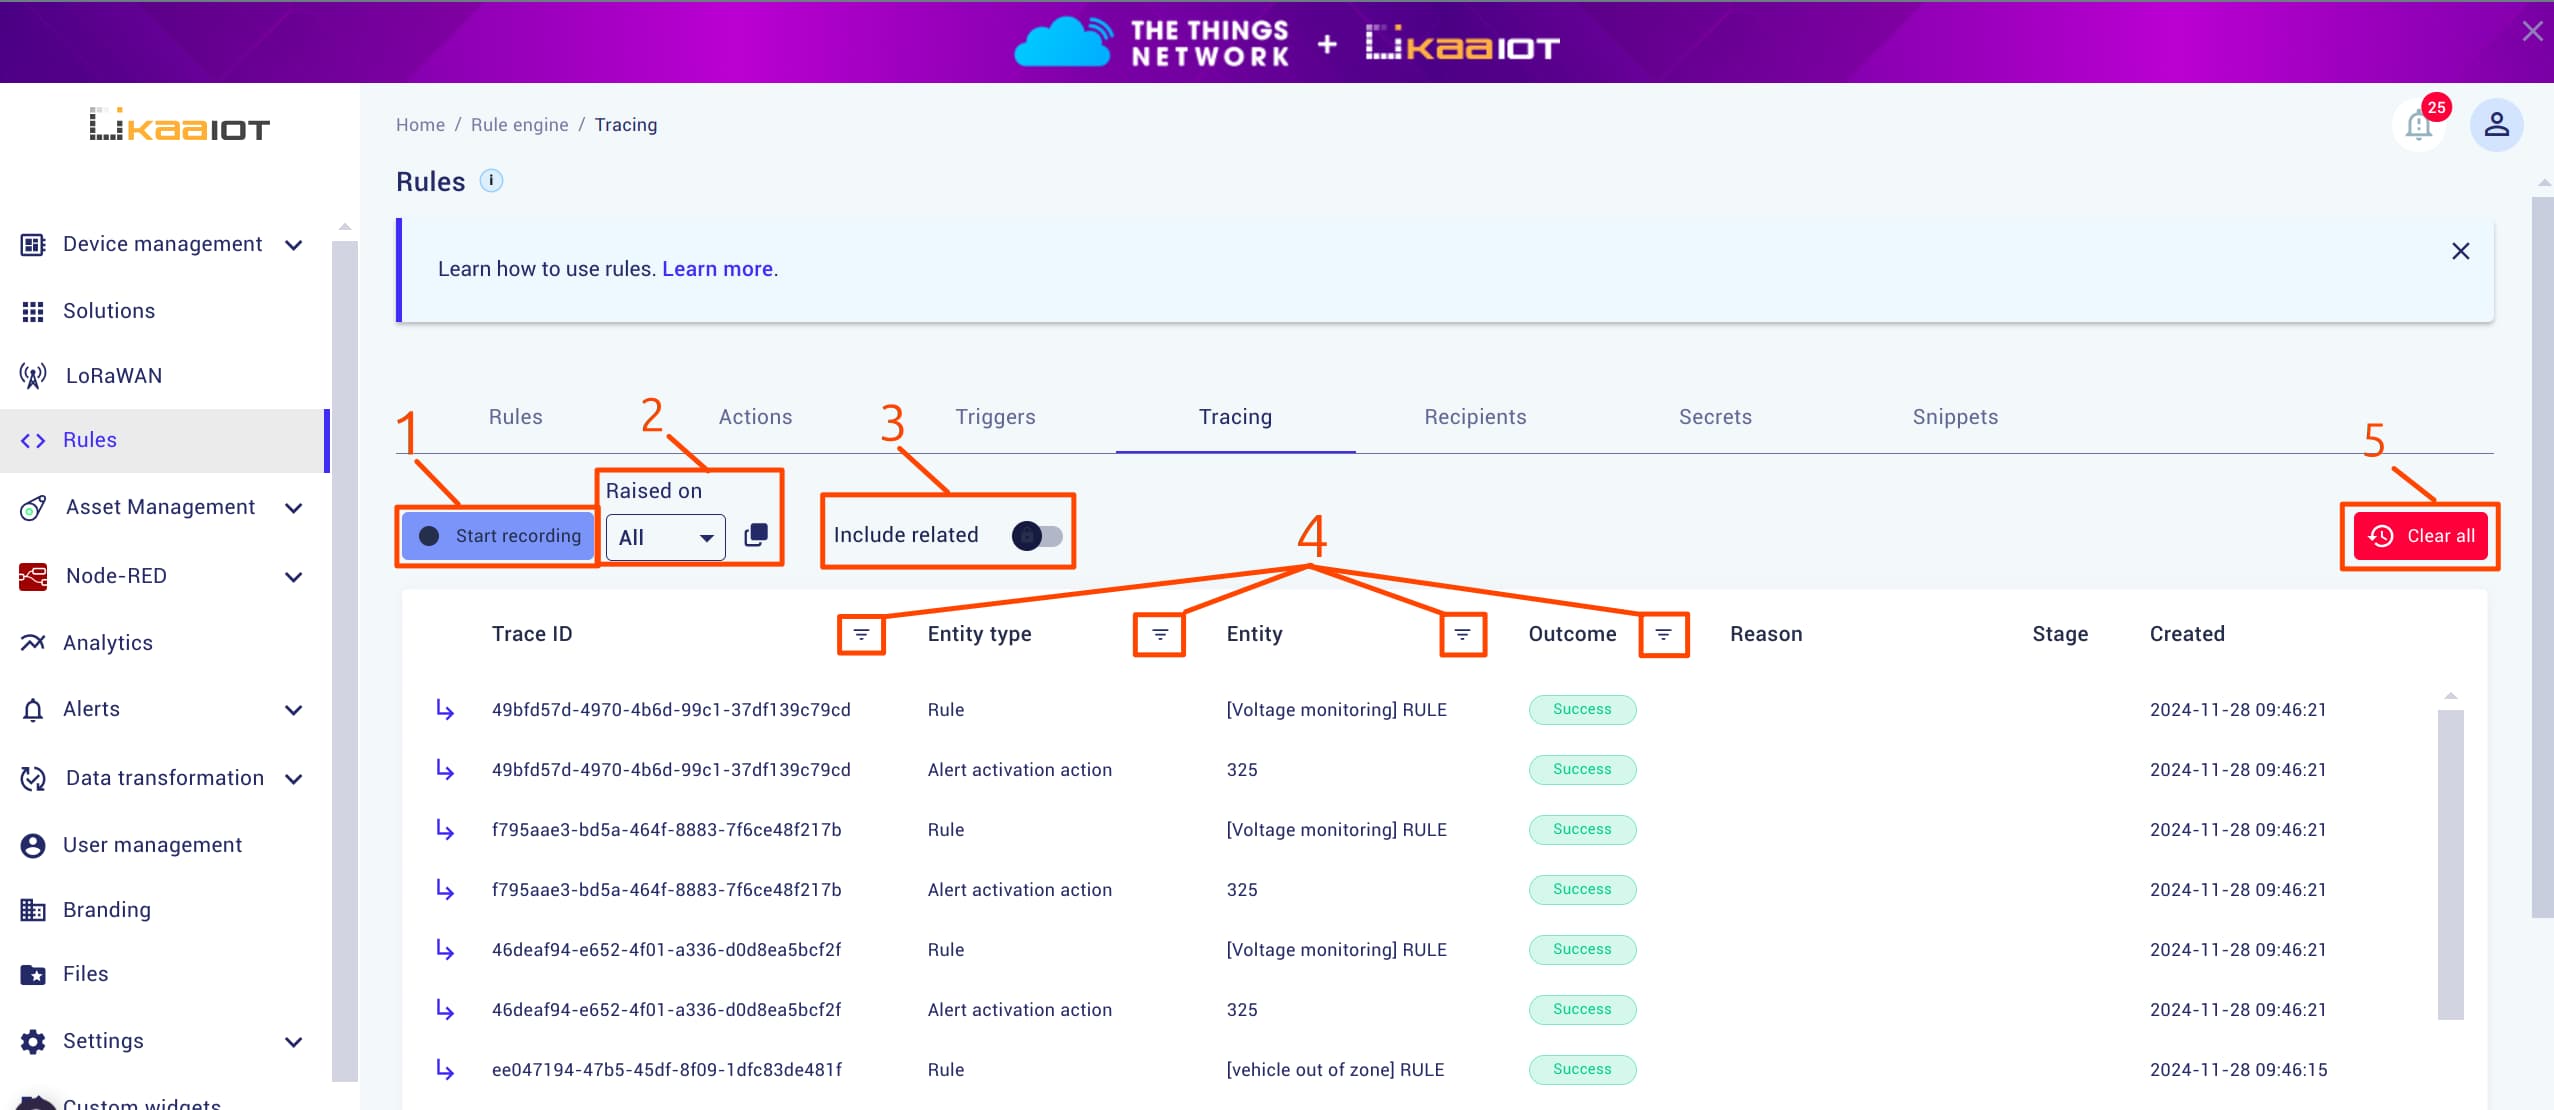
-
Start Recording:
When you open the Tracing tab, it automatically fetches the most recent logs. To continuously fetch new logs, click Start Recording. You can stop recording at any time and review the output. - Raised On: Provides filter options - On Demand and Endpoint.
- Endpoint: Selects logs related to a specific
endpointthat triggered therule. - On Demand: Selects logs generated by manual
ruleexecution from the rule page, meaning those that were not triggered by anendpoint.
- Endpoint: Selects logs related to a specific
-
Include Related Resources:
A singleruleusually consist of multipleactions. You can filter for a specificruleand enable this option to include all logs from relatedactions. This option is available only when ‘Rule’ is selected as both the Entity Type and the Entity. -
Basic Filters:
These filters help you find specific Rule Engine logs. Here, you can filter by “Entity type” and “Entity”.
These specify the type and instance of what produced the trace, such as a Rule or an Action. - Delete Traces:
This button deletes all recorded traces.
Example Debugging with Tracing
-
Click Start Recording, and if needed, filter by
Entity typeandEntity. - Go to “Device management” -> select your device -> “Data publish” tab.
Enter your endpoint token, copy and paste below payload, and hit “Send request”.
{
    "temperature": 21
}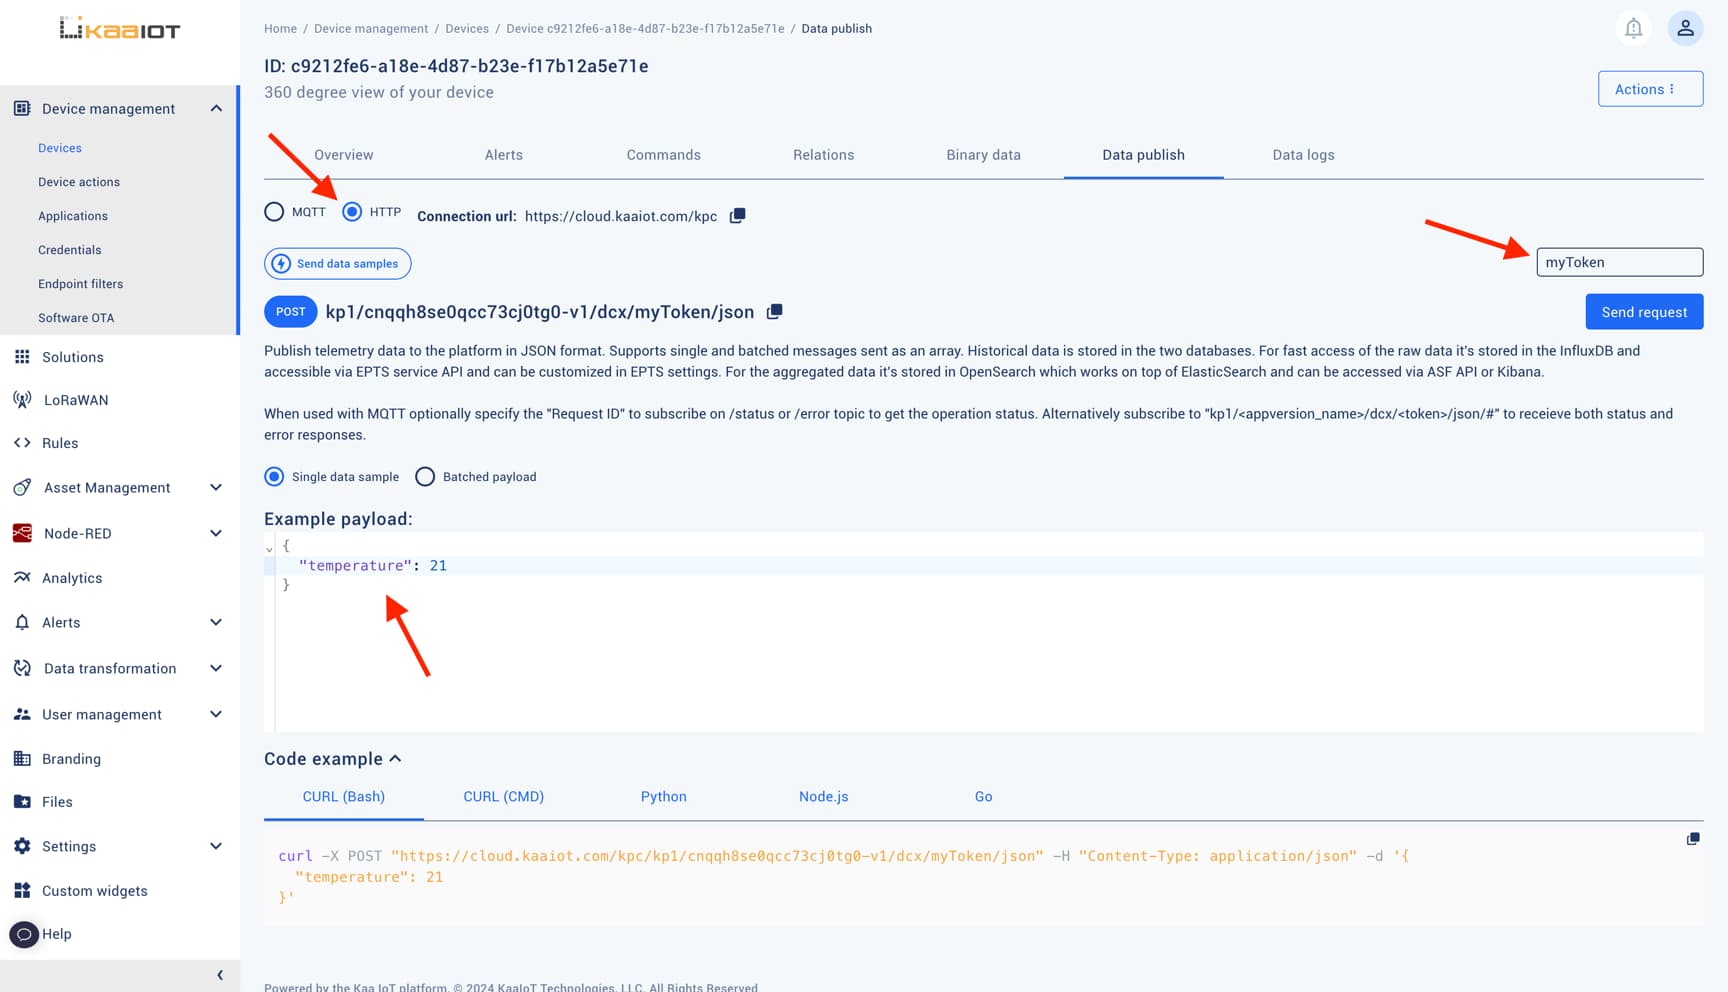
- Once the data is sent, Tracing will capture and log the event. Return back to “Rules” -> “Tracing” tab, and click on the newly appeared log in the trace list to see detailed information.
As shown in the screenshot, you should see the results:
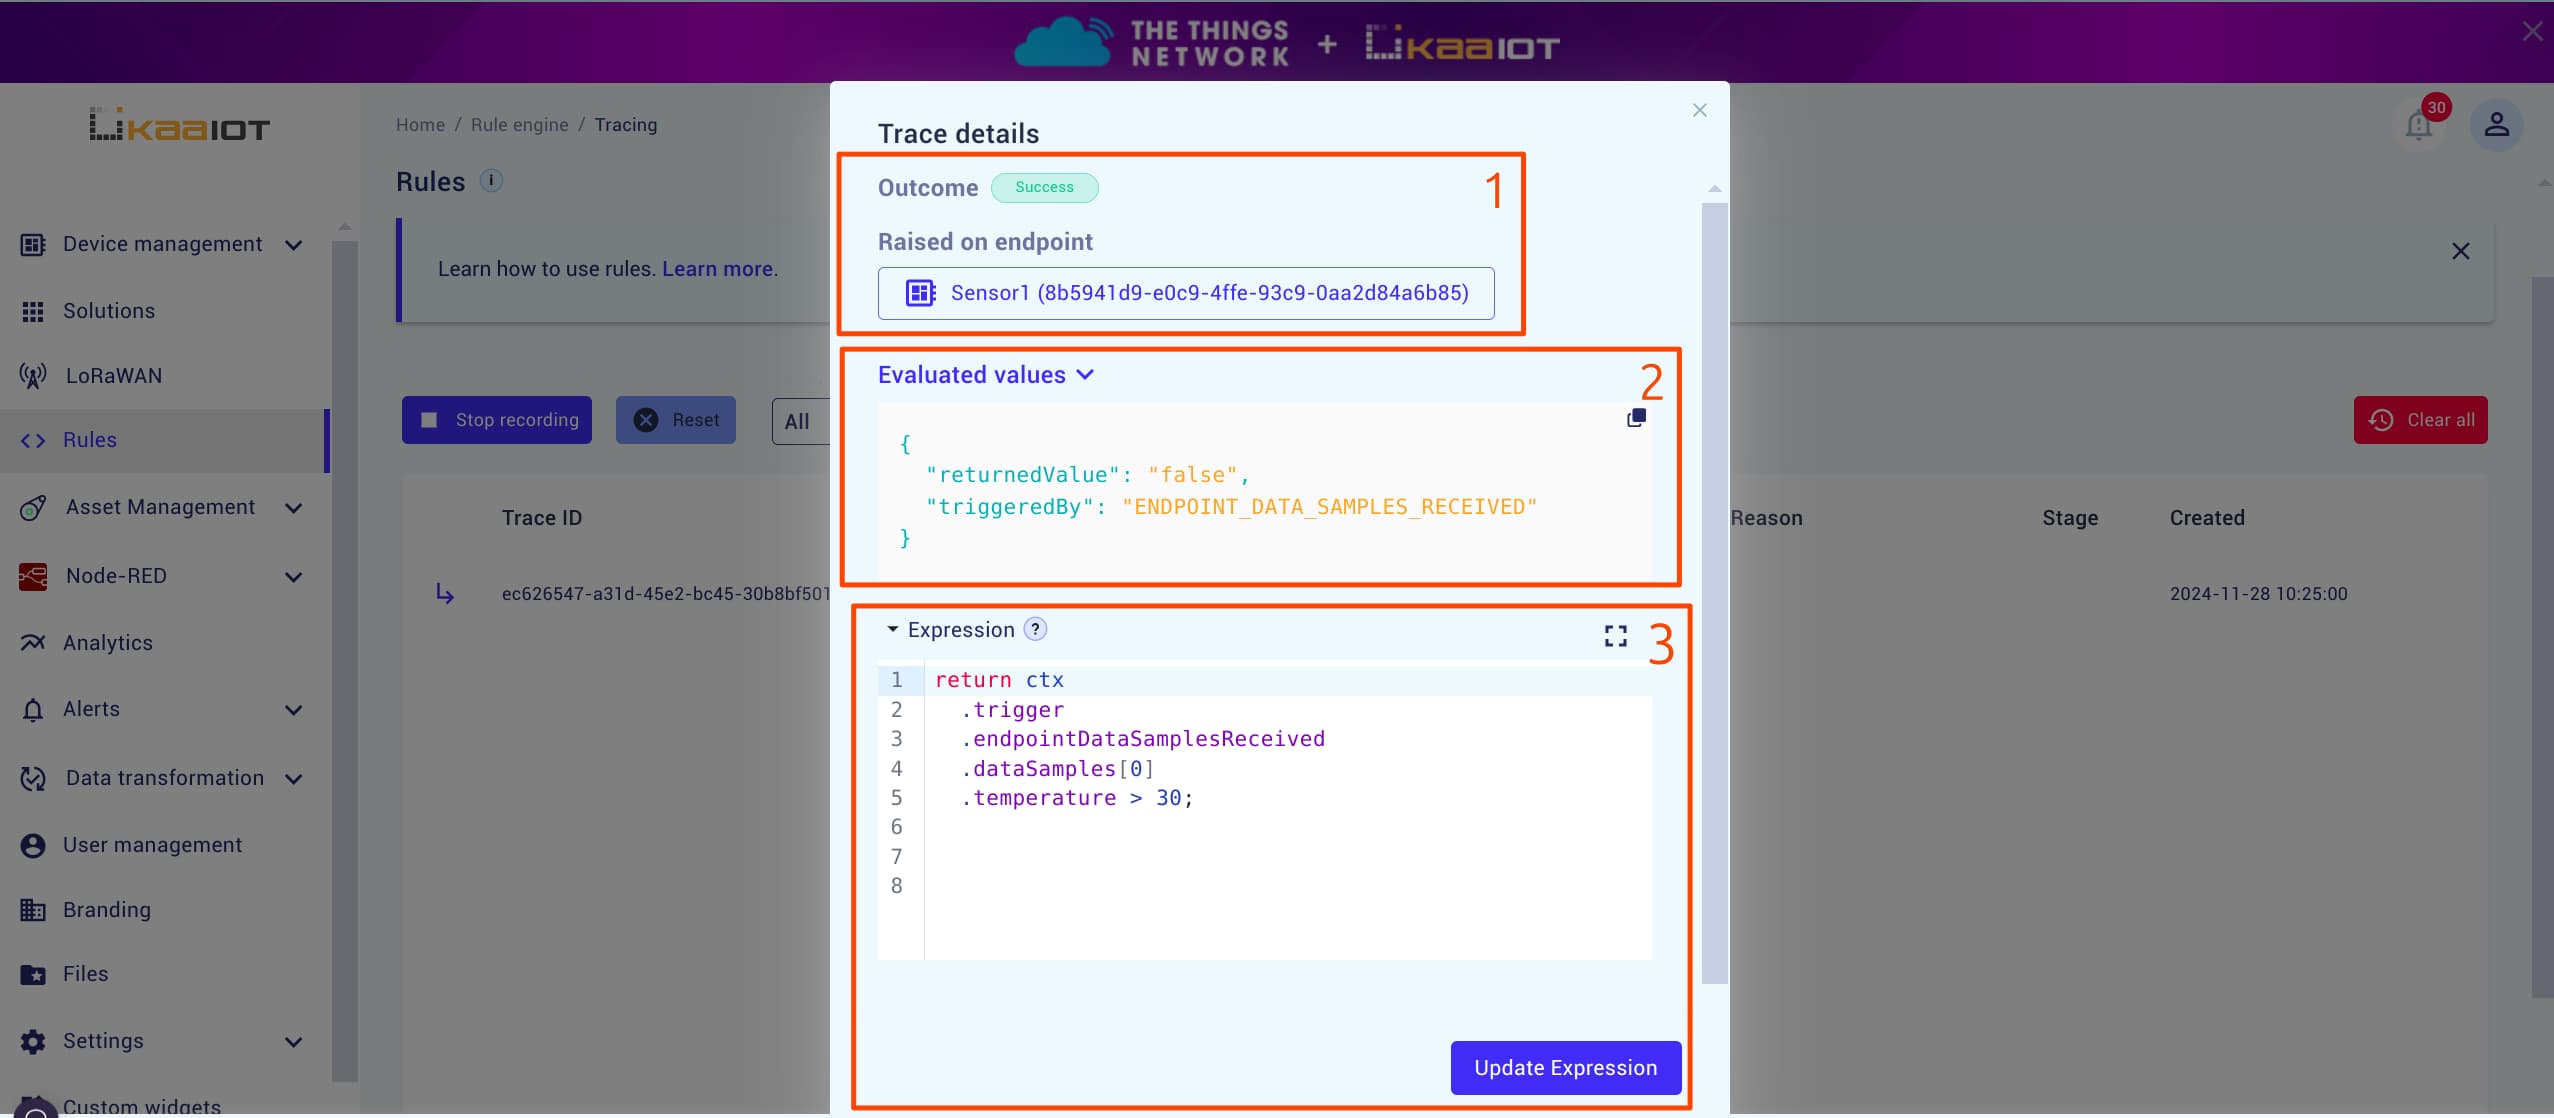
- Outcome and endpoint: Describes whether your code was valid and executed without errors. Also shows the endpoint on which rule was executed.
- Evaluated Values: Shows what values were returned and what Trigger triggered the rule.
- Expression Editor: Here, you can edit your rule’s expression. Changes won’t affect the current log but will apply to the new ones.
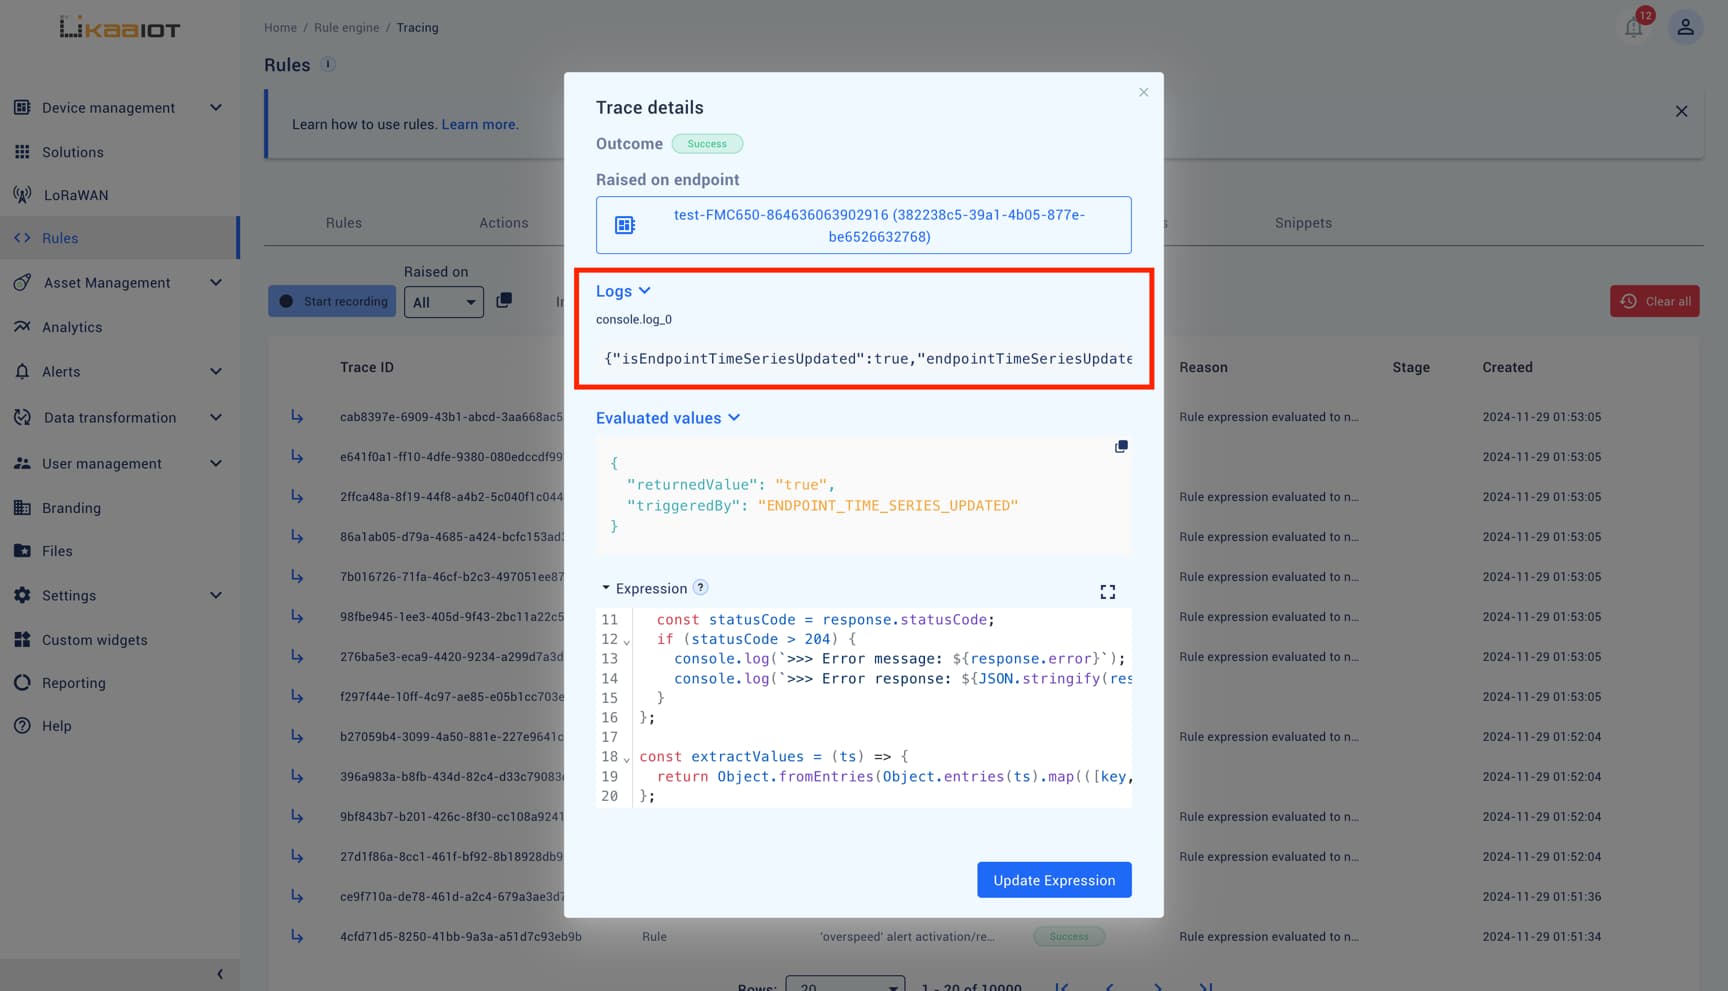
Console Logs
In addition to the tracing feature, you can log data using console.log(), just as you would in a typical JavaScript program, and view the output in the trace logs.
You may assume that you can use other JavaScript console methods like console.warn(), console.error(), or console.clear().
However, this is where confusion often arises.
IMPORTANT! In the Rule Engine, we do not have access to the standard JavaScript
consoleobject. Instead, a custom Javaconsoleobject with a singlelogmethod is provided.
This method has limitations:
- Accepts only strings: The
logmethod accepts only strings, and the maximum allowed length is 10,000 characters.- Logging objects: If you log an object, it may not behave as expected. To ensure proper logging, it’s recommended to
JSON.stringifyany objects before logging them.
Note: This custom behavior applies only to the
consoleandctx, which are custom-injected Java objects. For all other objects and methods, JavaScript behaves as expected.
Conclusion
That’s the basic overview of how to debug Rule Engine scripts in Kaa platform. I hope this guide has been helpful in getting you started with debugging your rules.