Data Collection Overview
Written by Andrew Pasika
What is Data Collection
Data collection refers to the process of gathering, transmitting, and storing data from connected devices, sensors, and other sources for further processing, analysis, and decision-making. Kaa tightly interconnects data collection with such terms like data sample, time series, and data point.
Data Sample
Think of a data sample as a block of data in JSON format that device sends to the platform for data collection.
Let’s consider an example.
You have a greenhouse monitoring station that consists of temperature, humidity and light sensors, and a gateway (e.g., Arduino) that all sensors are connected to. Every minute Arduino polls all connected sensors for their current values. Then the Arduino formats sensor values into a JSON object: this is a data sample, and sends it over MQTT or HTTP device API.
{
  "temperature": 25,
  "humidity": 46,
  "lux": 8600
}
Data sample batching
Let’s say Arduino from the above example operates in an offline mode and flushes collected from connected sensors data only once a day. It can use batching by sending several data samples at once.
The next example contains three data samples that represent three separate readings.
[
  {
    "timestamp": 1566987697005,
    "temperature": 25,
    "humidity": 46,
    "lux": 8600
  },
  {
    "timestamp": 1566988116155,
    "temperature": 24,
    "humidity": 48,
    "lux": 8300
  },
  {
    "timestamp": 1566988157463,
    "temperature": 26,
    "humidity": 49,
    "lux": 8900
  }
]
What you can do with telemetry using Kaa
Kaa provides you with the next features regarding telemetry:
- Upload telemetry from device using Device MQTT or HTTP APIs
- Monitor traffic coming from and to device
- Visualize telemetry
- Transform telemetry into time series
- Process telemetry with Rule Engine
- Configure alerts on telemetry values
- Retrieve telemetry using REST API
Upload telemetry from device using MQTT or HTTP
You can upload telemetry data from your device using the next Device APIs:
Refer to Connecting your first device from Getting Started for deeper knowledge.
Monitor traffic coming from and to device
Once your device starts sending telemetry into Kaa, the first thing you can do to check if it was successfully delivered is to check device’s logs via Kaa UI.
Go to Device management -> Devices -> your device -> “Data logs” tab

Visualize telemetry
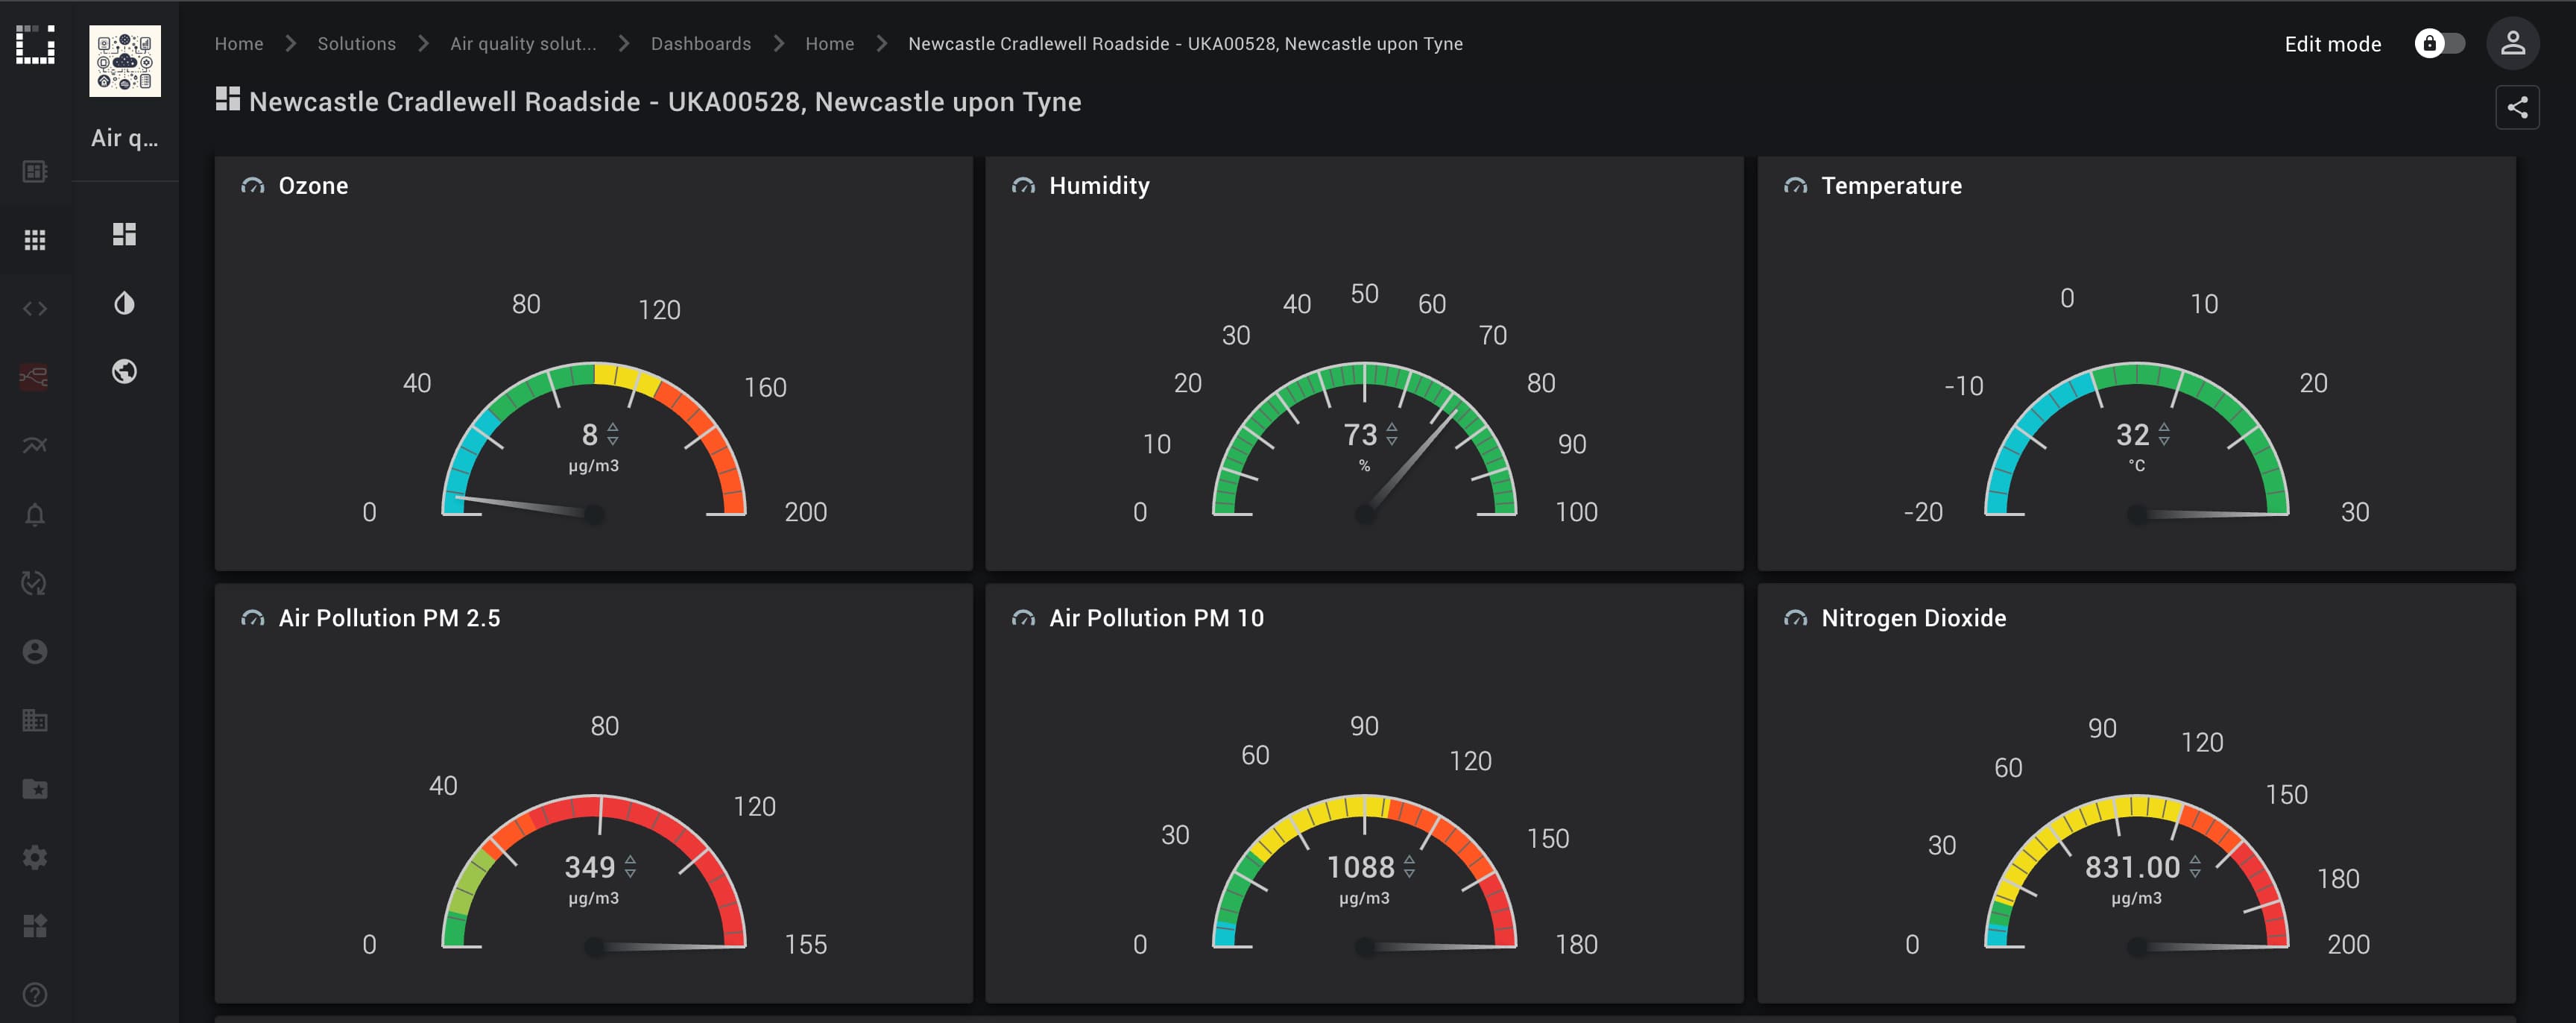
Kaa UI provides rich set of widgets that you can use to visualise telemetry data. Let’s go through some of them.
Charts

Gauges

Maps

Labels

Transform telemetry into time series
Kaa can transform data samples into time series. Time series is a named sequence of data points. Each data point contains a timestamp and one or more named values. A set of value names and their types (numeric, string, boolean) defines a time series.
You may want different time series defined for various things.
For example, a fuel level time series may only have one numeric value: level.
On the other hand, a geolocation time series may have several numeric values: latitude, longitude, and in some applications altitude.
You can configure Kaa to transform data samples (telemetry) received from endpoints into time series for displaying them on charts, gauges, maps, etc. as mentioned above.
Also, Kaa has an auto-extraction feature that stores each numeric top-level data sample field into a separate time-series.
All auto-extracted time series have a name that follows the pattern auto~<field name> and one numeric value with the name value.
So, if your endpoint sends data a sample with two fields, e.g.:
{
  "temperature": 23,
  "humidity": 48
}
and the auto-extraction feature is enabled, Kaa creates two time-series: auto~temperature and auto~humidity.
You can enable auto-extraction feature in Device management → Applications → your application → “epts” (Kaa component responsible for time series processing).

Process telemetry with Rule Engine
Once telemetry is in Kaa, you can apply various rules with the help of Rule Engine. Rule Engine allows you to write rules of any complexity using the most popular programming language in the world - JavaScript.
Processing telemetry data with Rule Engine you can perform the next things in real time:
- Generate alerts base on telemetry values
- Execute webhooks
- Invoke command on device
- Update device metadata
- Modify or enrich incoming data before storing it
- Find delta between previous and current telemetry value
- Run complex calculations based on real-time plus historical data
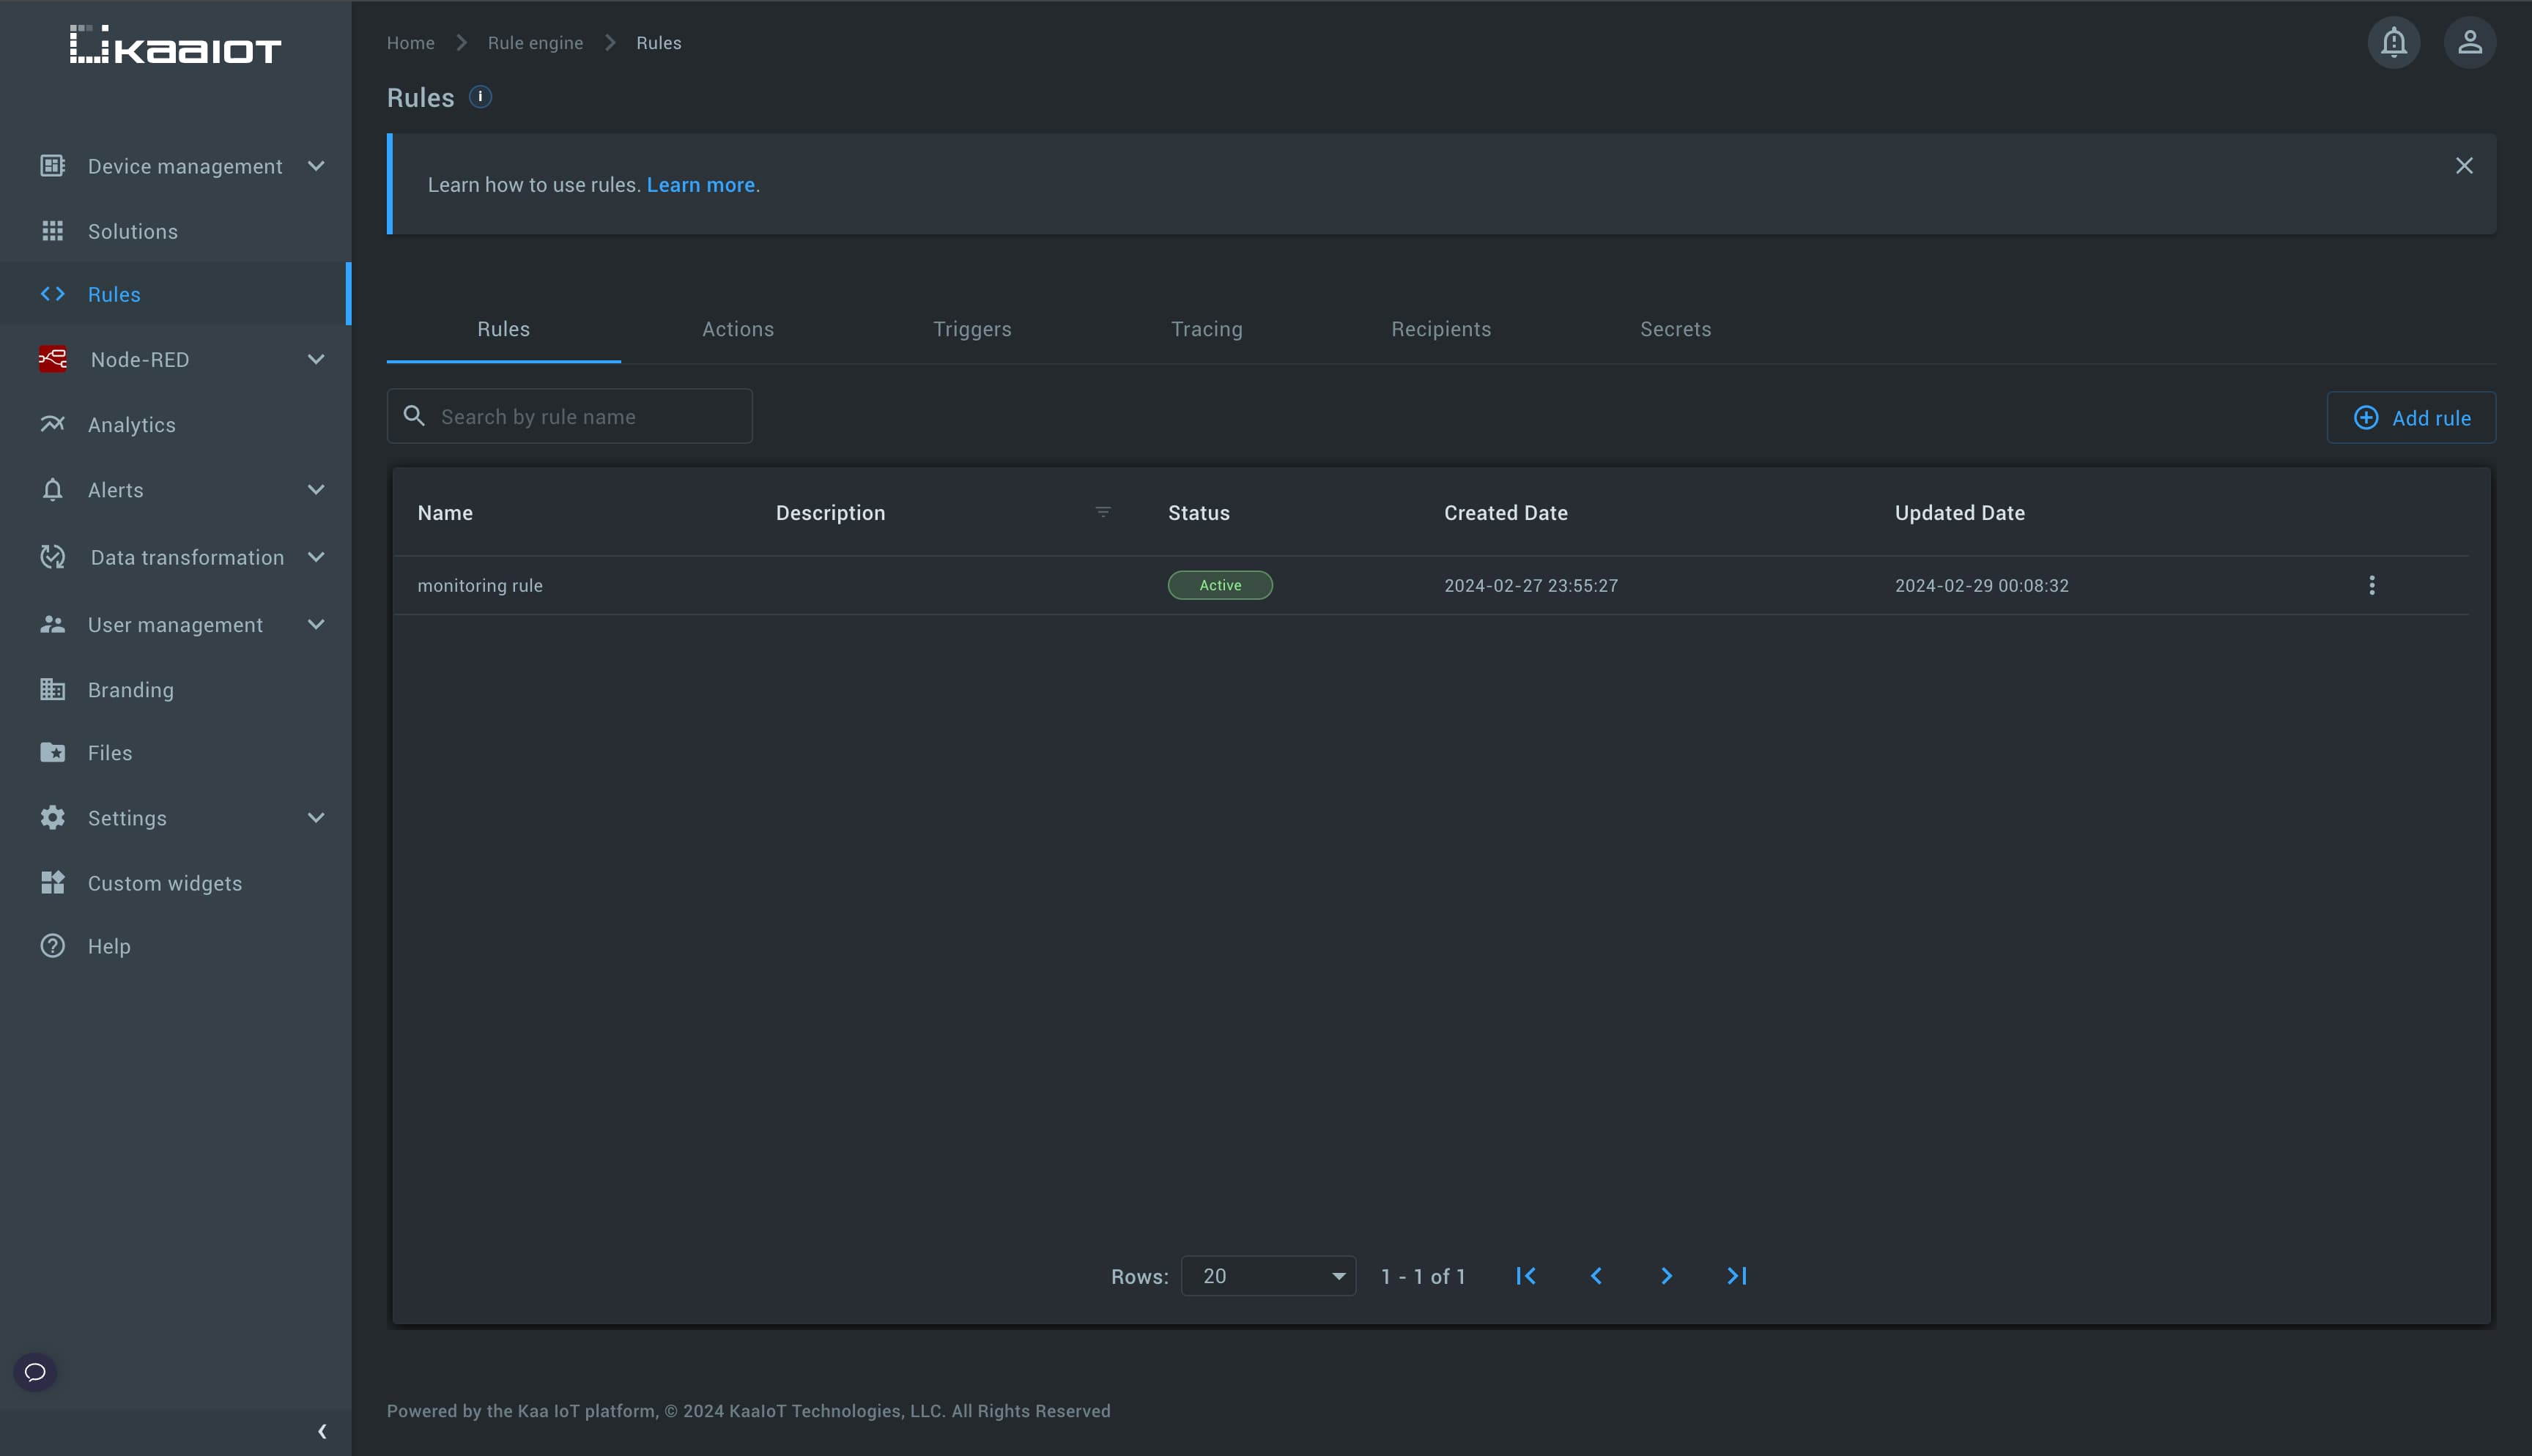
Visit Rules section in Kaa UI and explore Rule Engine capabilities. Rule Engine documentation section will give you more details.

Configure alerts on telemetry values
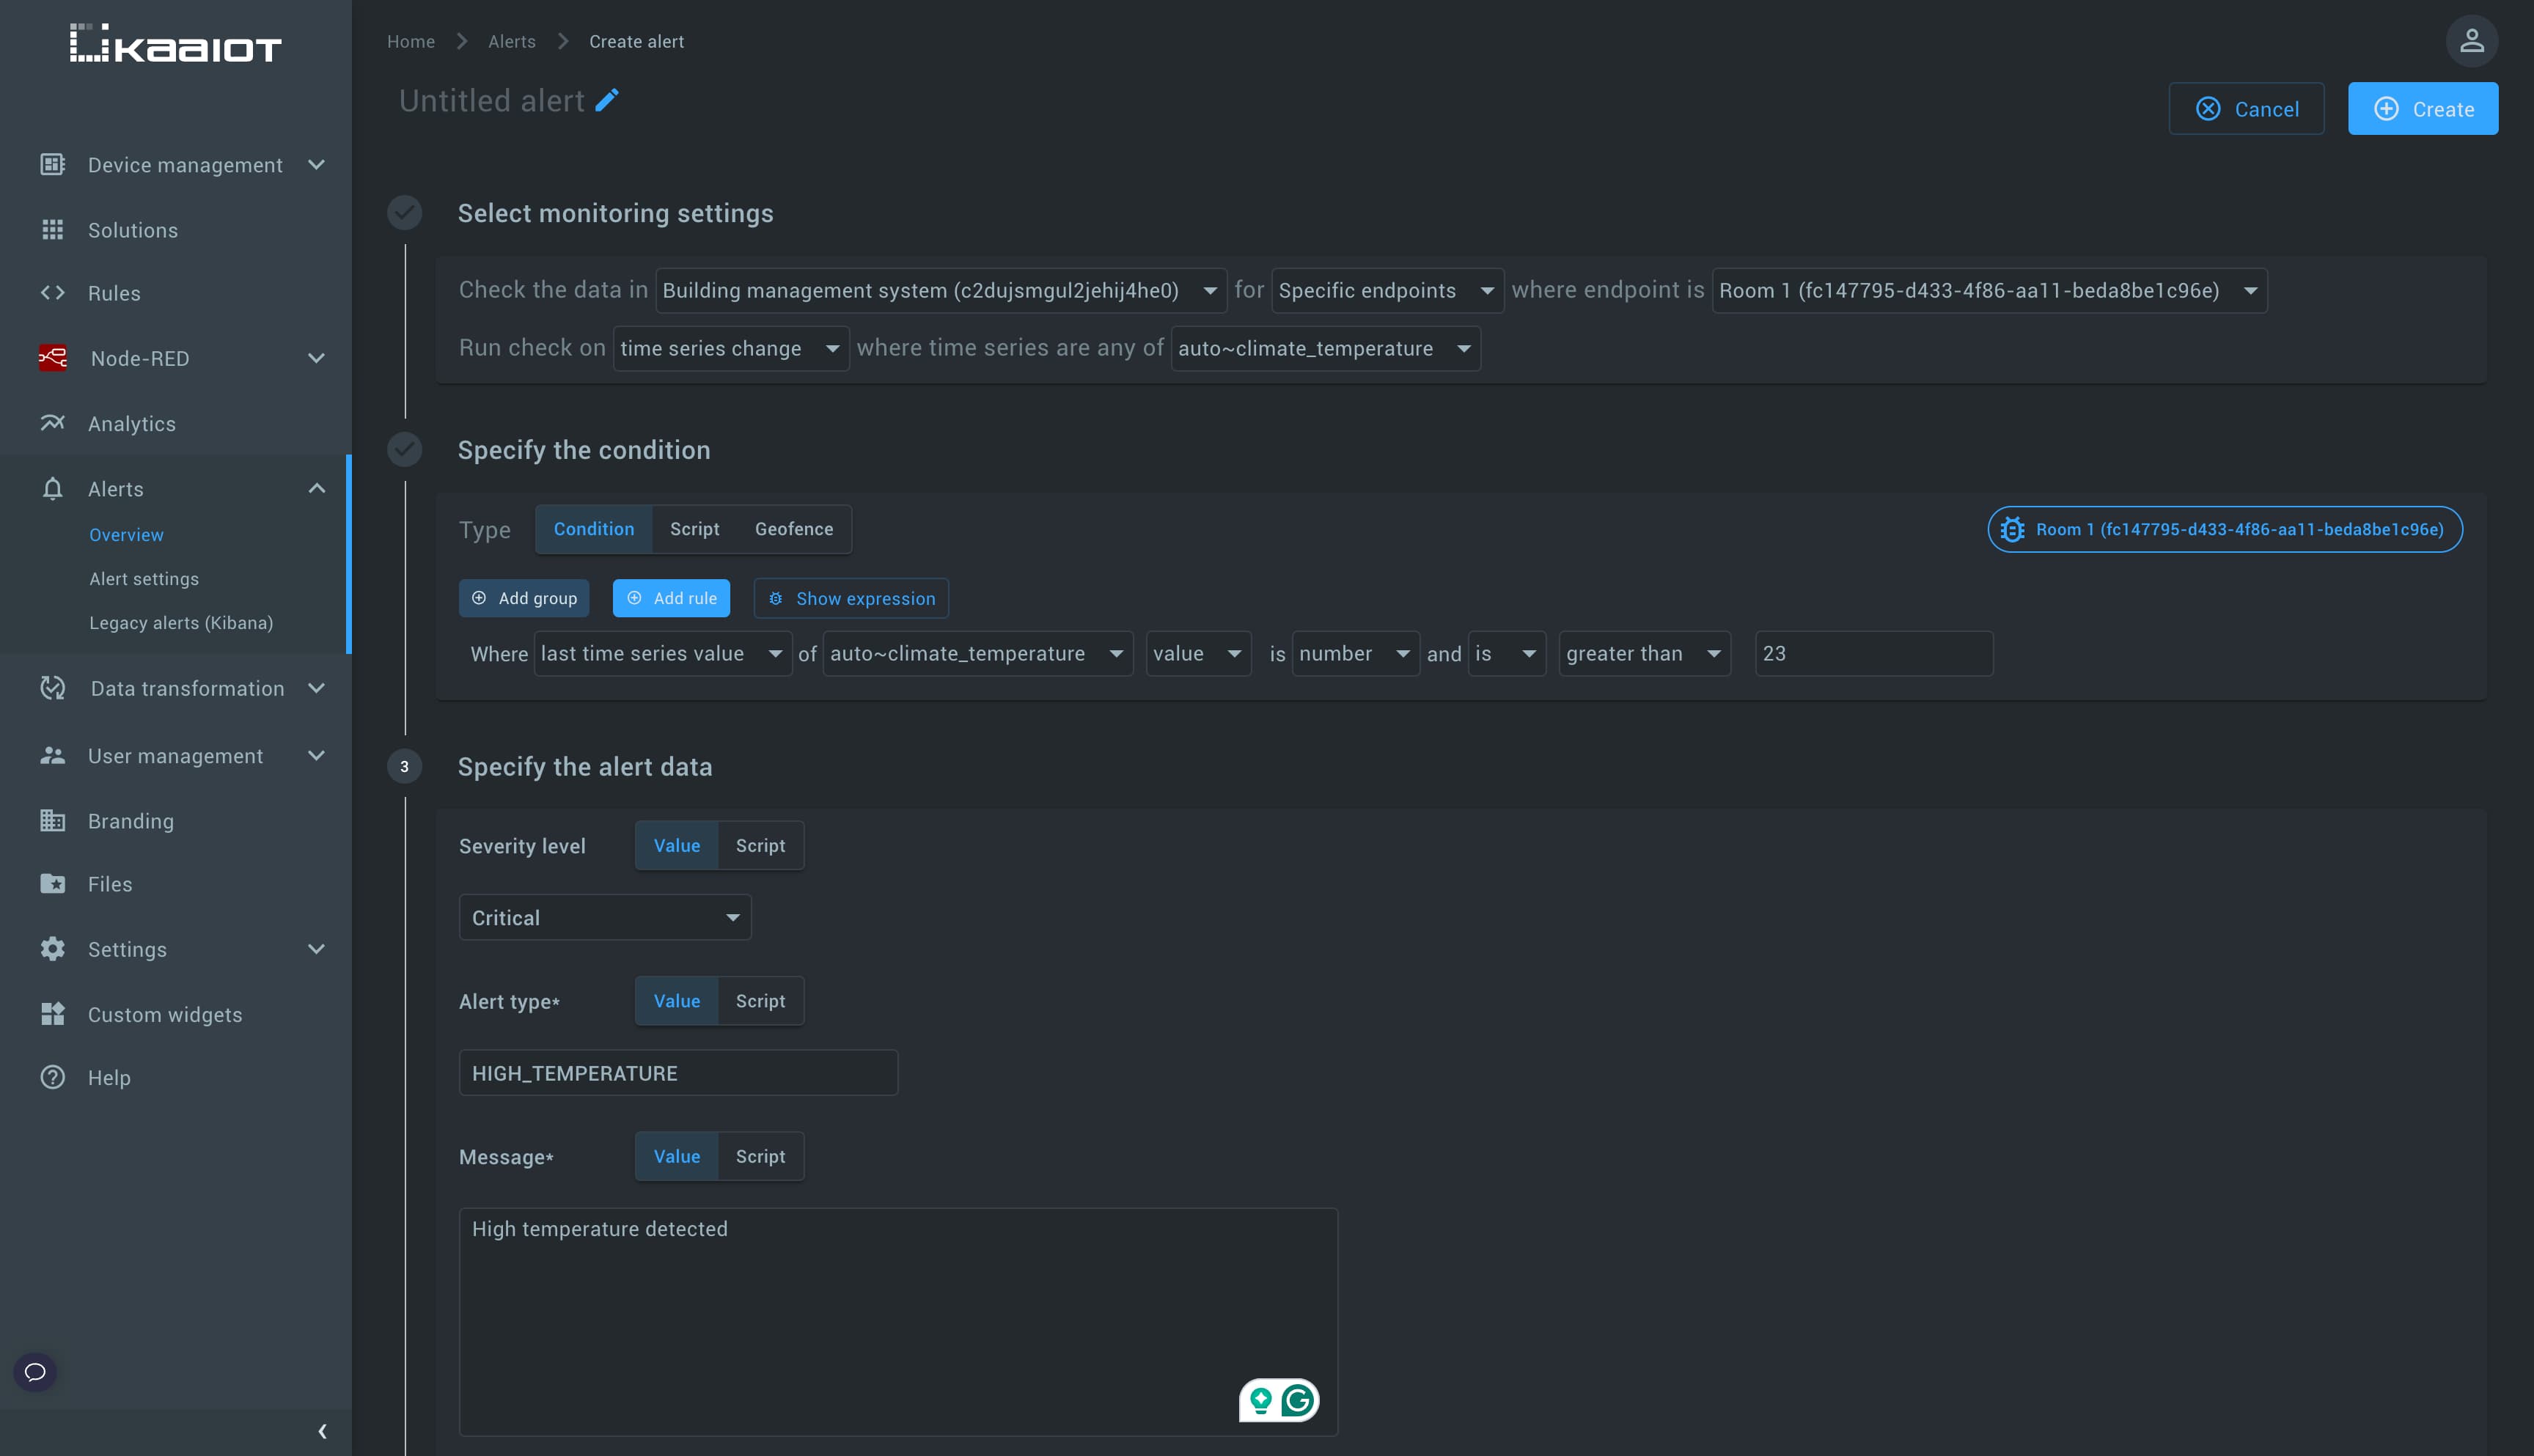
Kaa can monitor incoming telemetry in real time and create alerts once preconfigured condition is met. Alerts are built on top of Rule Engine.
Visit Alerts -> Alerts settings section in Kaa UI and explore alert capabilities.

Retrieve telemetry using REST API
Refer to REST API documentation on how you can retrieve telemetry.


